Power BI Dashboards We Deliver
Transform your raw data into powerful, interactive dashboards. We build custom Power BI solutions that help you make faster, smarter decisions.
We help businesses transform raw data into interactive dashboards, real-time analytics, and smarter decision-making using Microsoft Power BI. With expert Power BI consulting and data visualization services, we help companies connect multiple data sources, automate reporting, and build powerful dashboards that deliver real business insights.

13 Reviews

3 Reviews
35 Reviews
Project Count
Years of Experience
Team Size
Long Time Clients

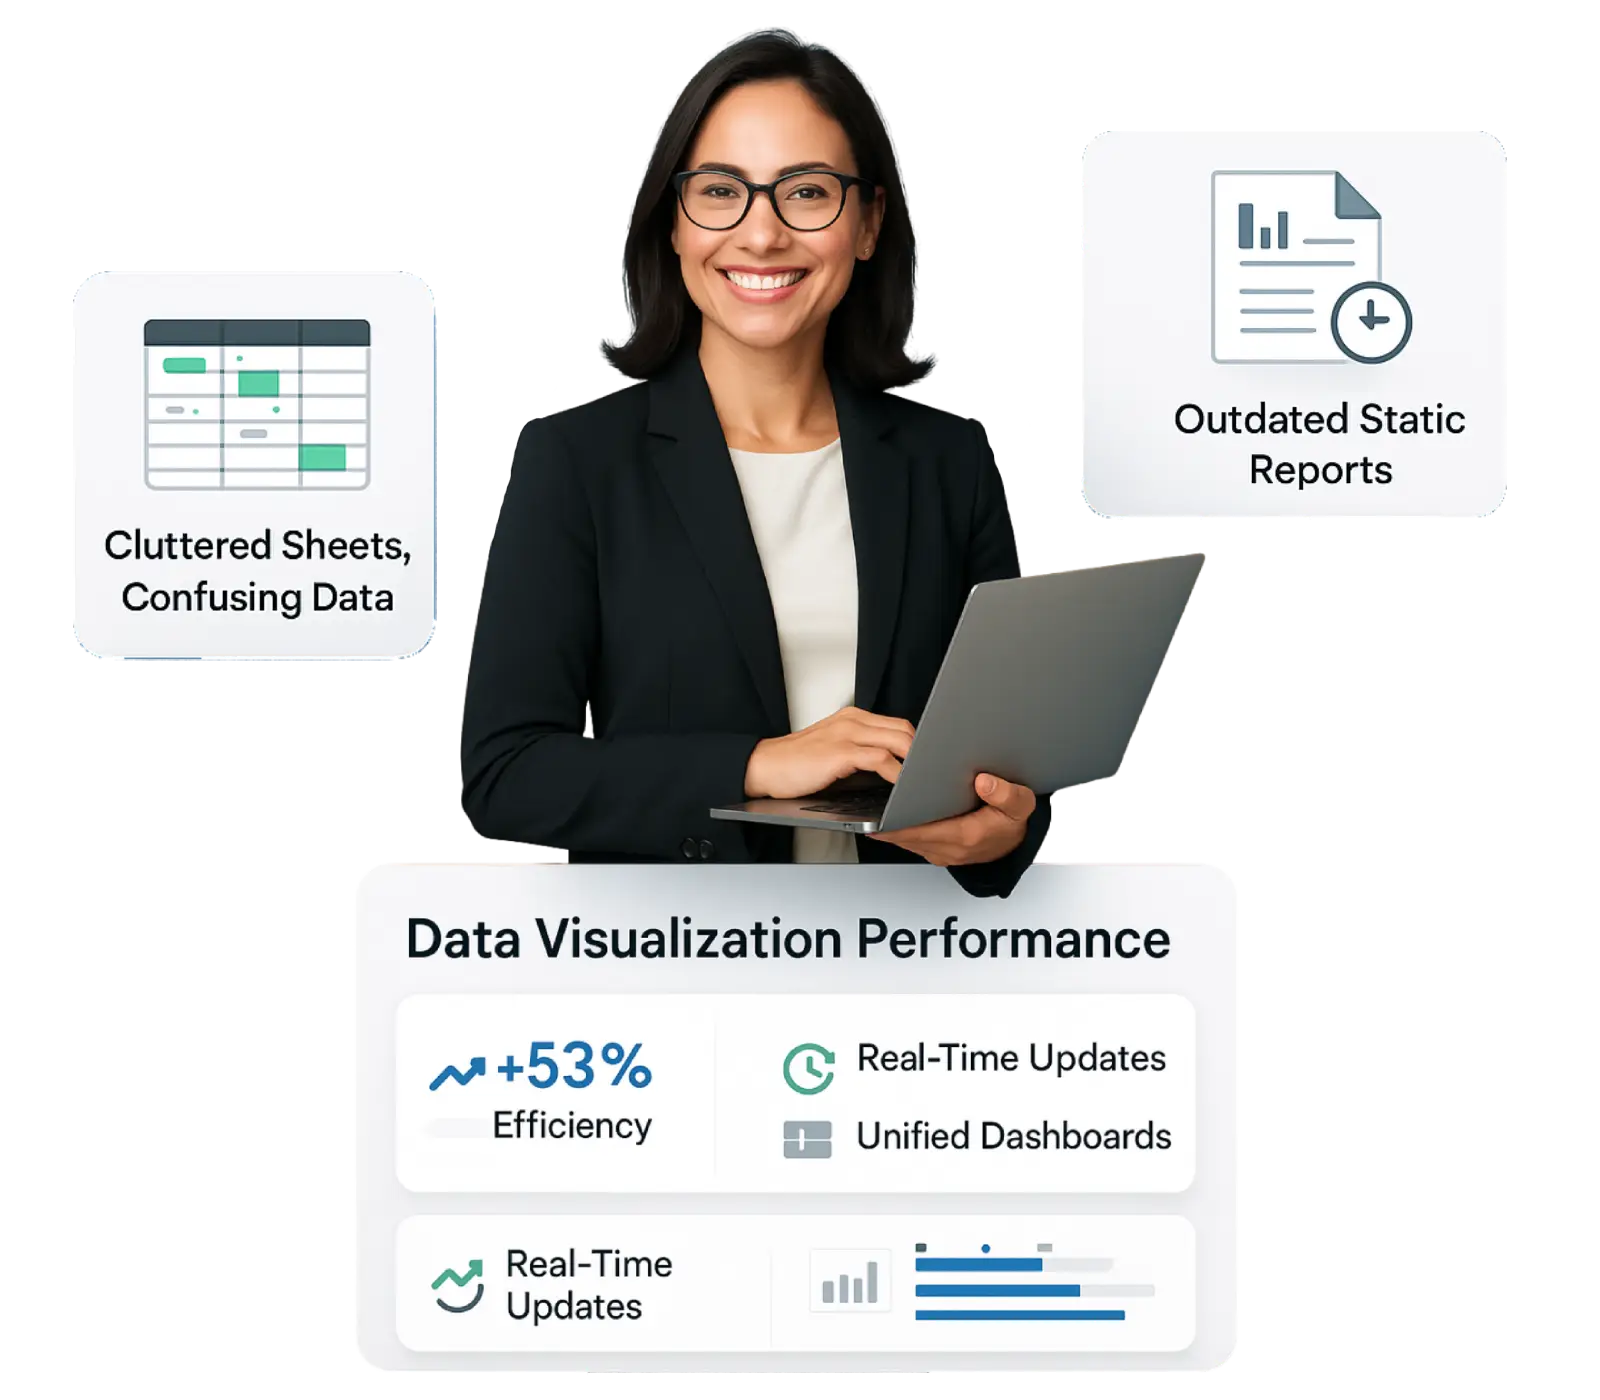
Data scattered across multiple systems like Excel, CRM, ERP, and databases
Difficulty creating clear and meaningful reports
Slow decision-making due to manual reporting
Lack of real-time business visibility
Transform your raw data into powerful, interactive dashboards. We build custom Power BI solutions that help you make faster, smarter decisions.
Take a closer look at how we’ve helped businesses grow through custom software development solutions that solve real-world problems and support long-term business growth.
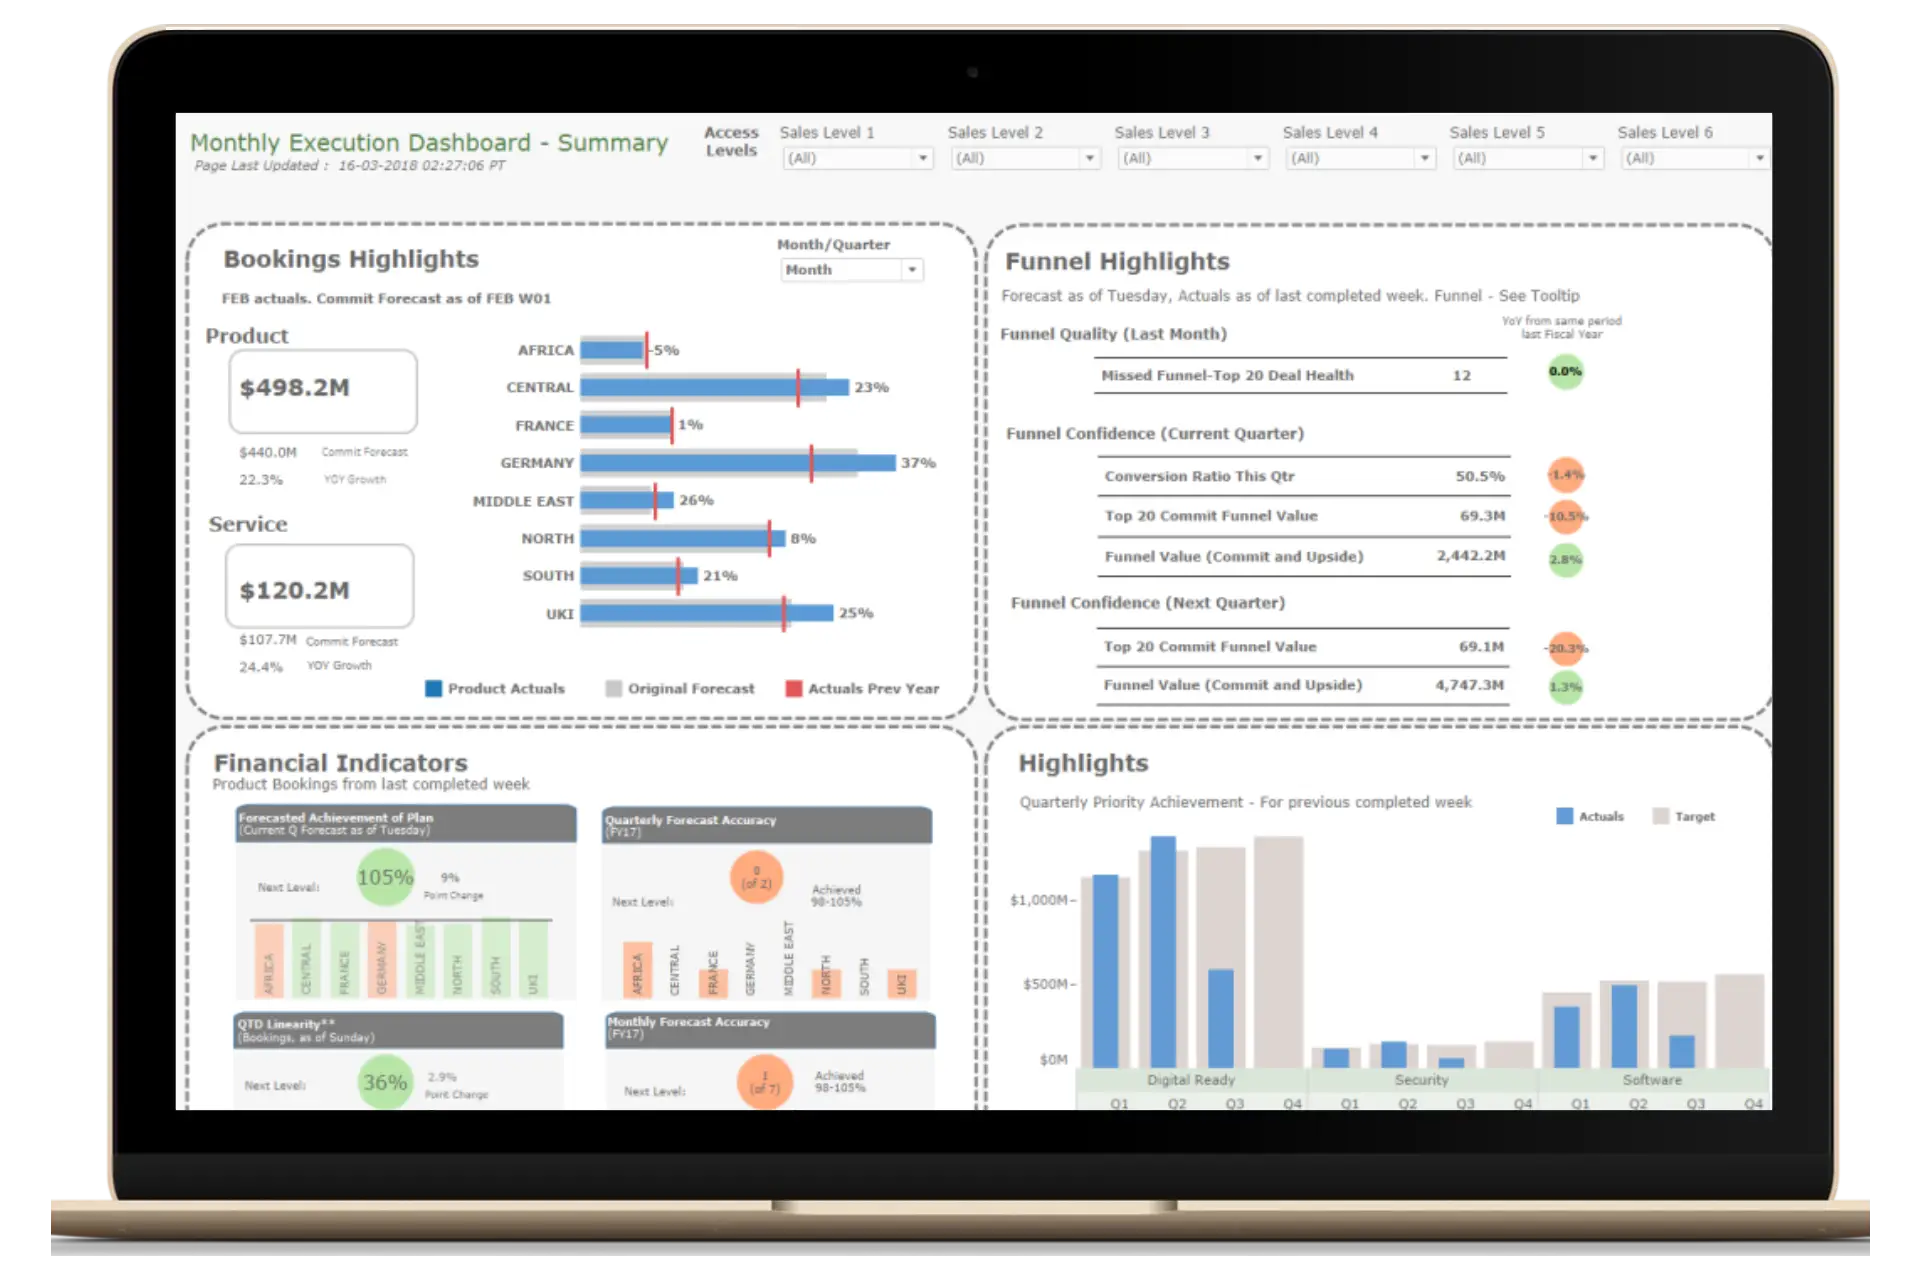
We developed this interactive dashboard to track the execution performance of multiple products and services across global regions. It presents visibility into bookings vs. forecast, quarterly targets, sales funnel health, and financial KPIs such as forecast accuracy and plan achievement.
Designed for executive and sales leadership, the dashboard empowers decision-makers to compare actual vs. committed values, spot underperforming markets, and align efforts with quarterly and yearly goals.
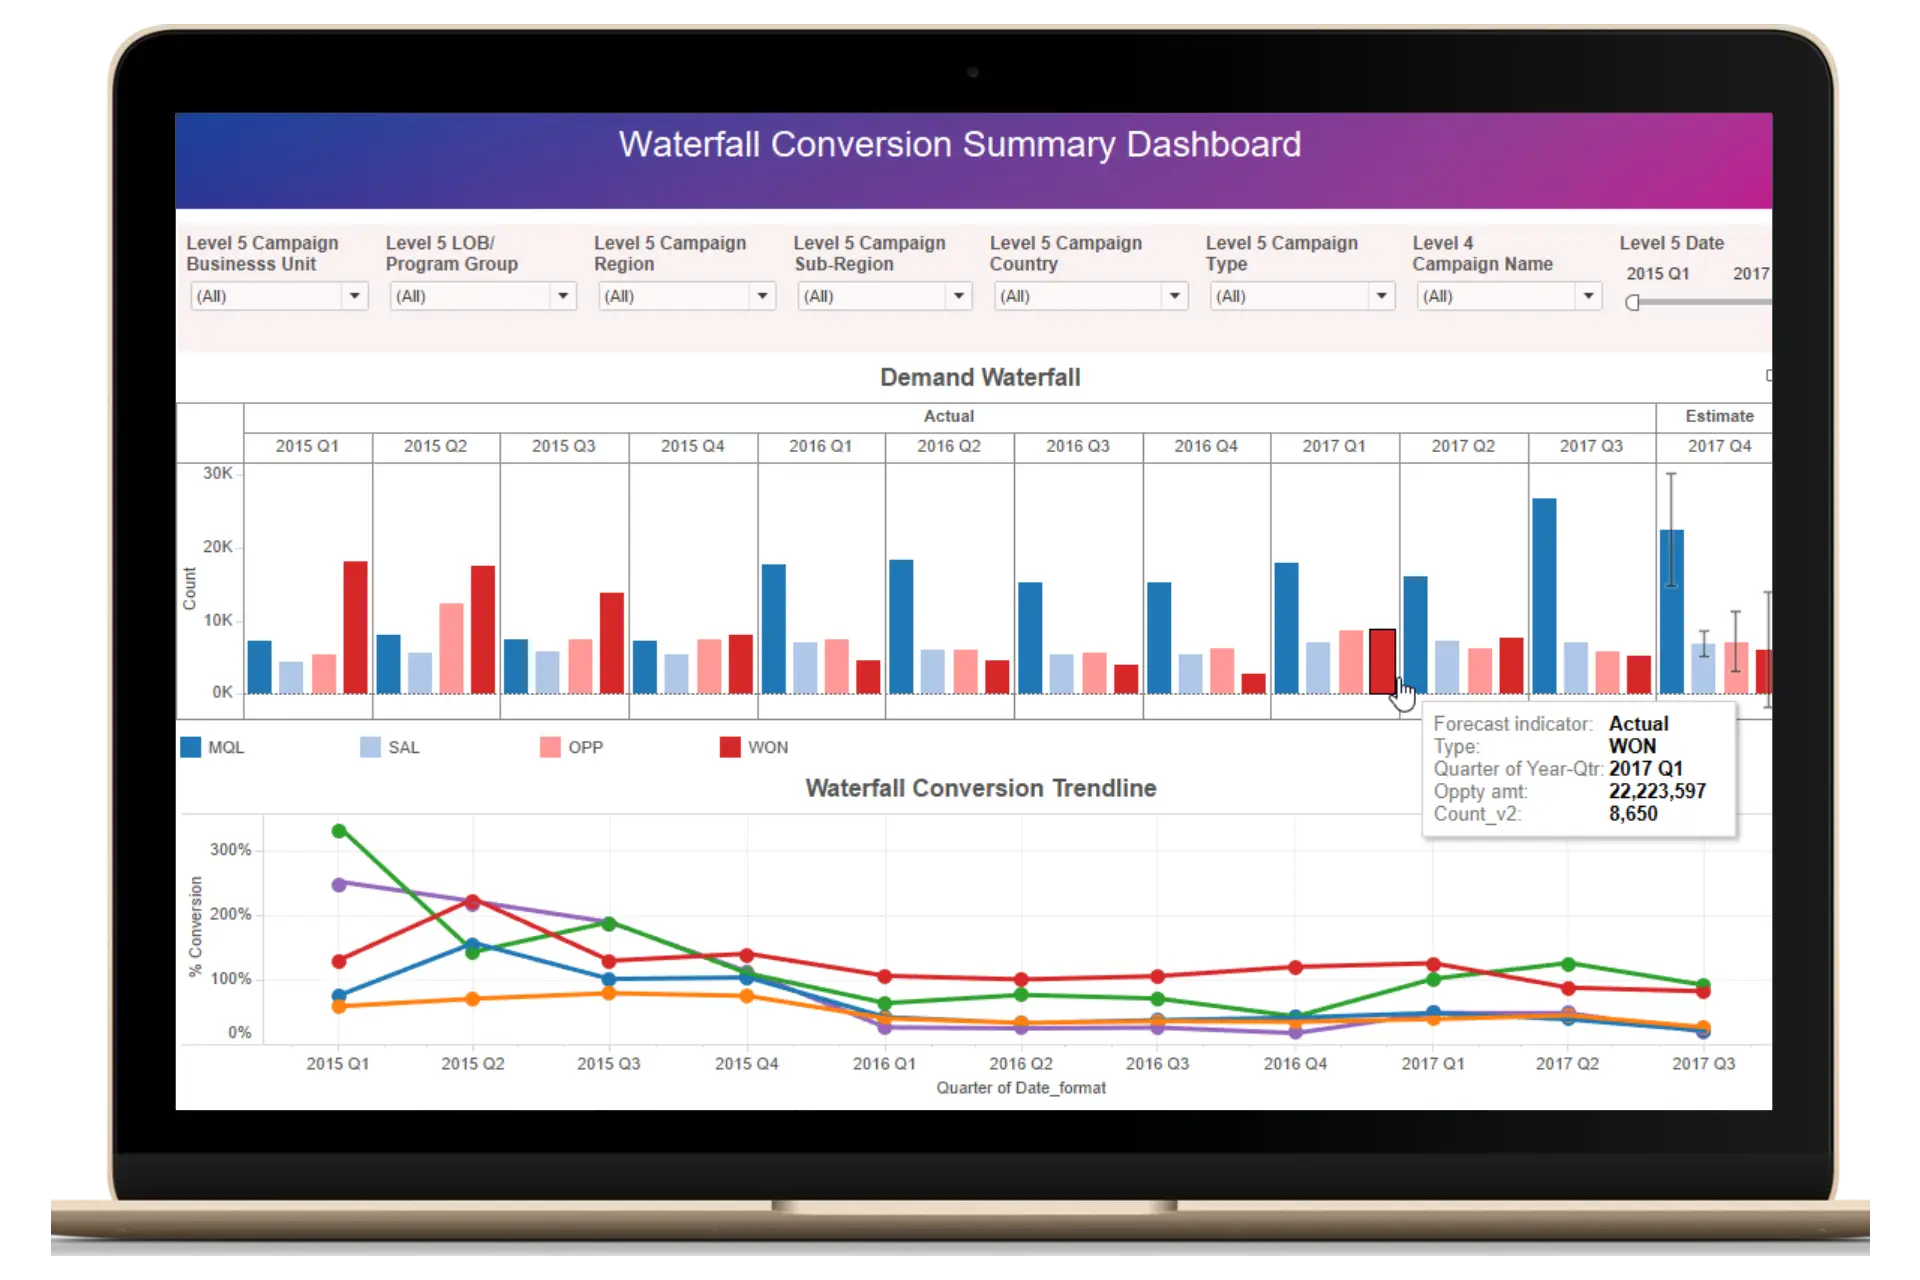
Waterfall Conversion Dashboard to help marketing teams measure campaign effectiveness across global regions. Built using Tableau, it visualizes the end-to-end journey from MQL (Marketing Qualified Leads) to final conversions (WON), enabling stakeholders to understand funnel drop-offs and improve decision-making.
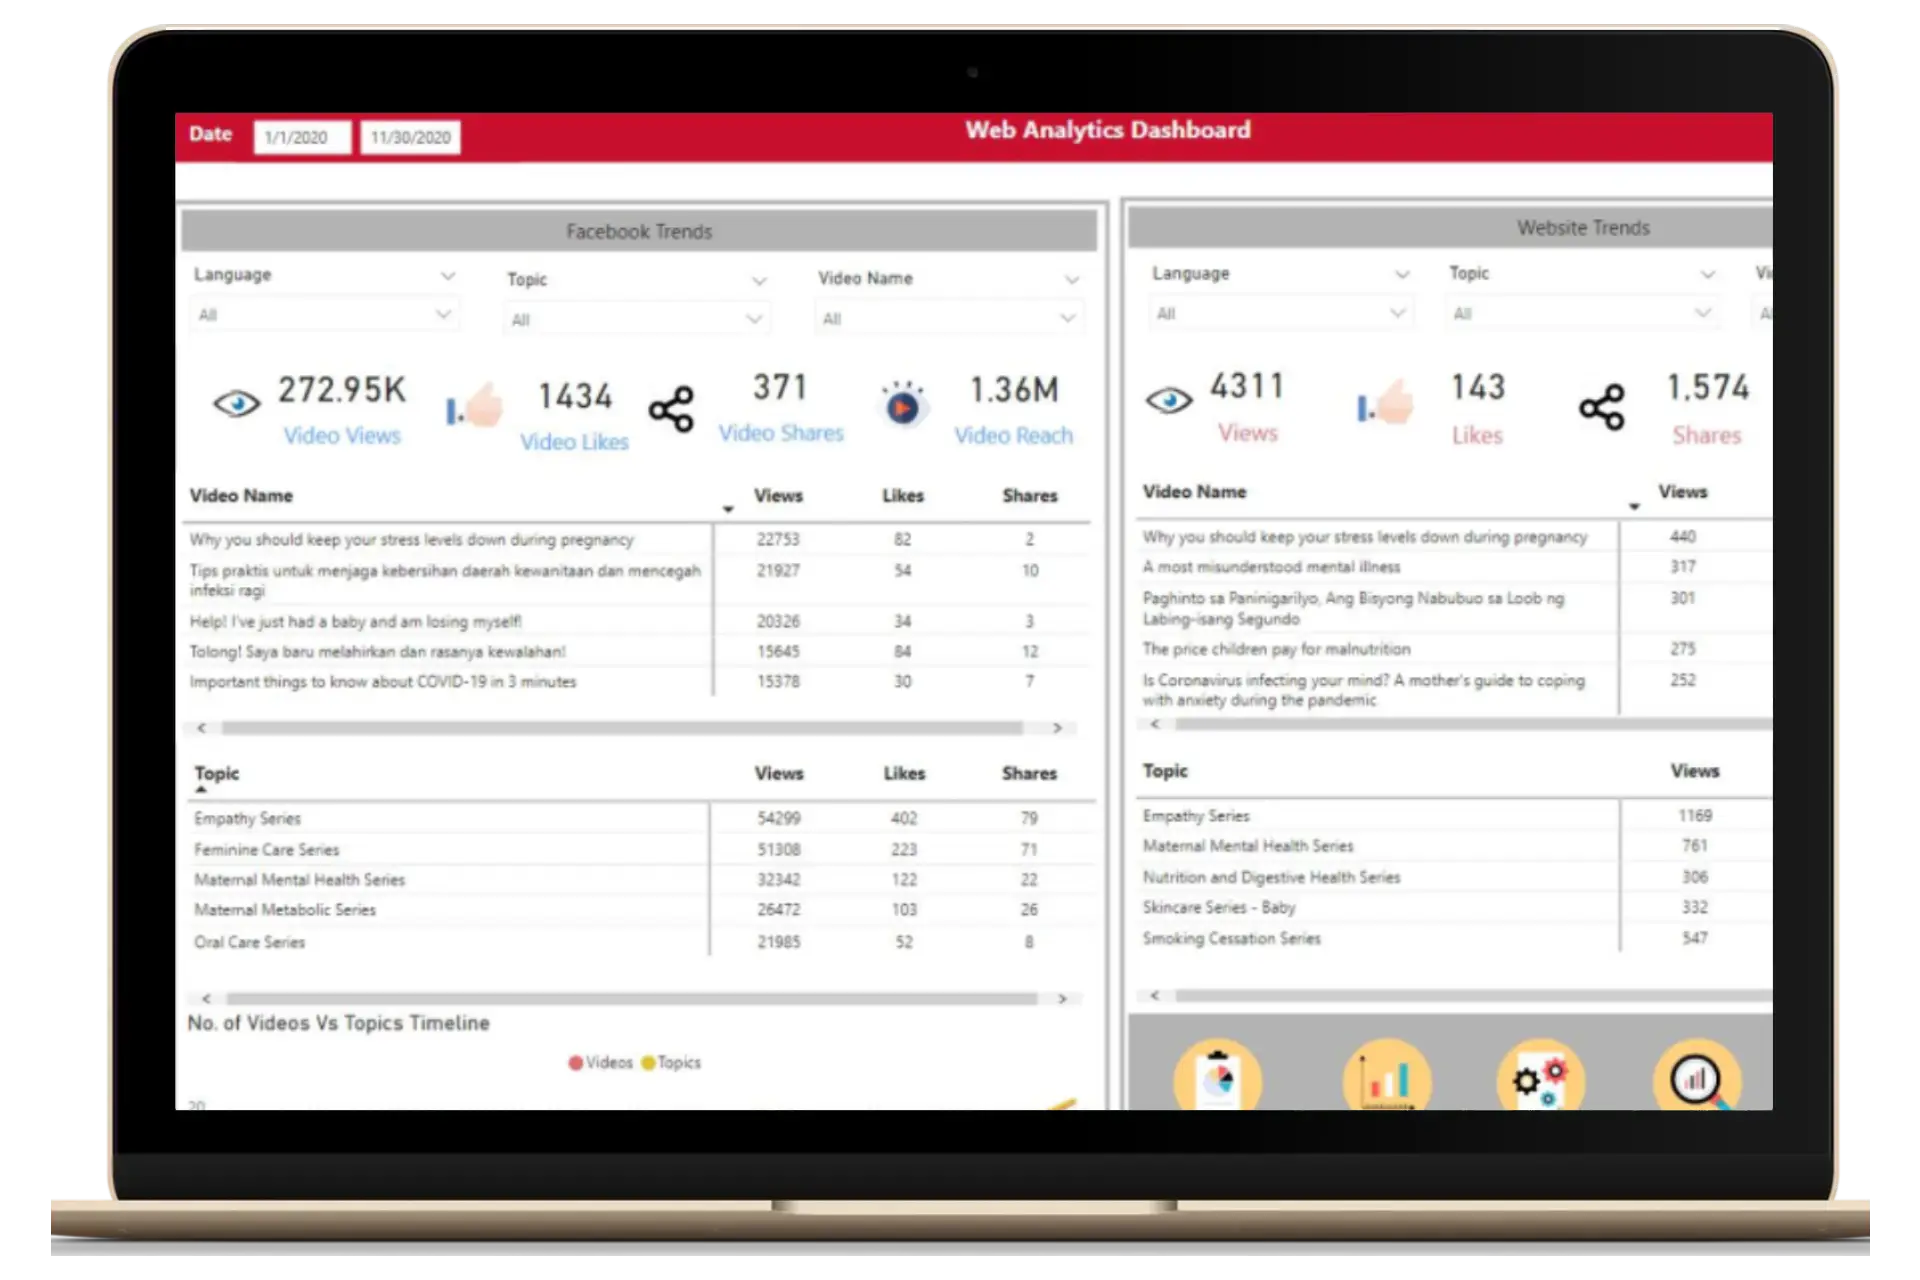
We created a comprehensive dashboard for a nonprofit organization focused on maternal and child health. The dashboard consolidated historical data from Facebook and website analytics to visualize key engagement metrics, such as video reach, user interactions, and demographic trends. It helped the client better understand their audience behaviour and optimize content for stronger digital outreach.
![]() Power BI
Power BI
 Tableau
 Looker Studio
 D3.js
D3.js
 Highcharts
 Metabase
 Superset
Real-Time Data Insights :Monitor your business performance with live dashboards.
Automated Reporting :Reduce manual reporting efforts with automated dashboards.
Data from Multiple Sources :Integrate Excel, SQL, CRM, ERP, APIs, and more.
Scalable BI Solutions :Solutions that grow with your business.
Improved Business Efficiency :Save time and improve productivity with streamlined analytics.
Watch what our clients have to say about partnering with us — their journeys, challenges, and how our software solutions helped them grow and succeed.
CFO, Direct Services Group Holdings
Avenida Wohnbau, Germany
CEO, Tex Goddess, USA
CEO, LEprivacy, USA
CEO, Selfgast, Germany
Serving all industries without exception, we craft solutions that empower businesses to enhance efficiency, improve performance, and achieve sustainable growth.
Share your data sources and business goals with our experts. We transform your data into powerful Power BI dashboards and actionable analytics.
We analyze your business goals, data sources, and reporting needs.
Our experts connect and organize your data from multiple systems.
We design interactive Power BI dashboards and visualizations.
We test the dashboards to ensure performance and accuracy.
We deploy the solution and train your team to use Power BI effectively.
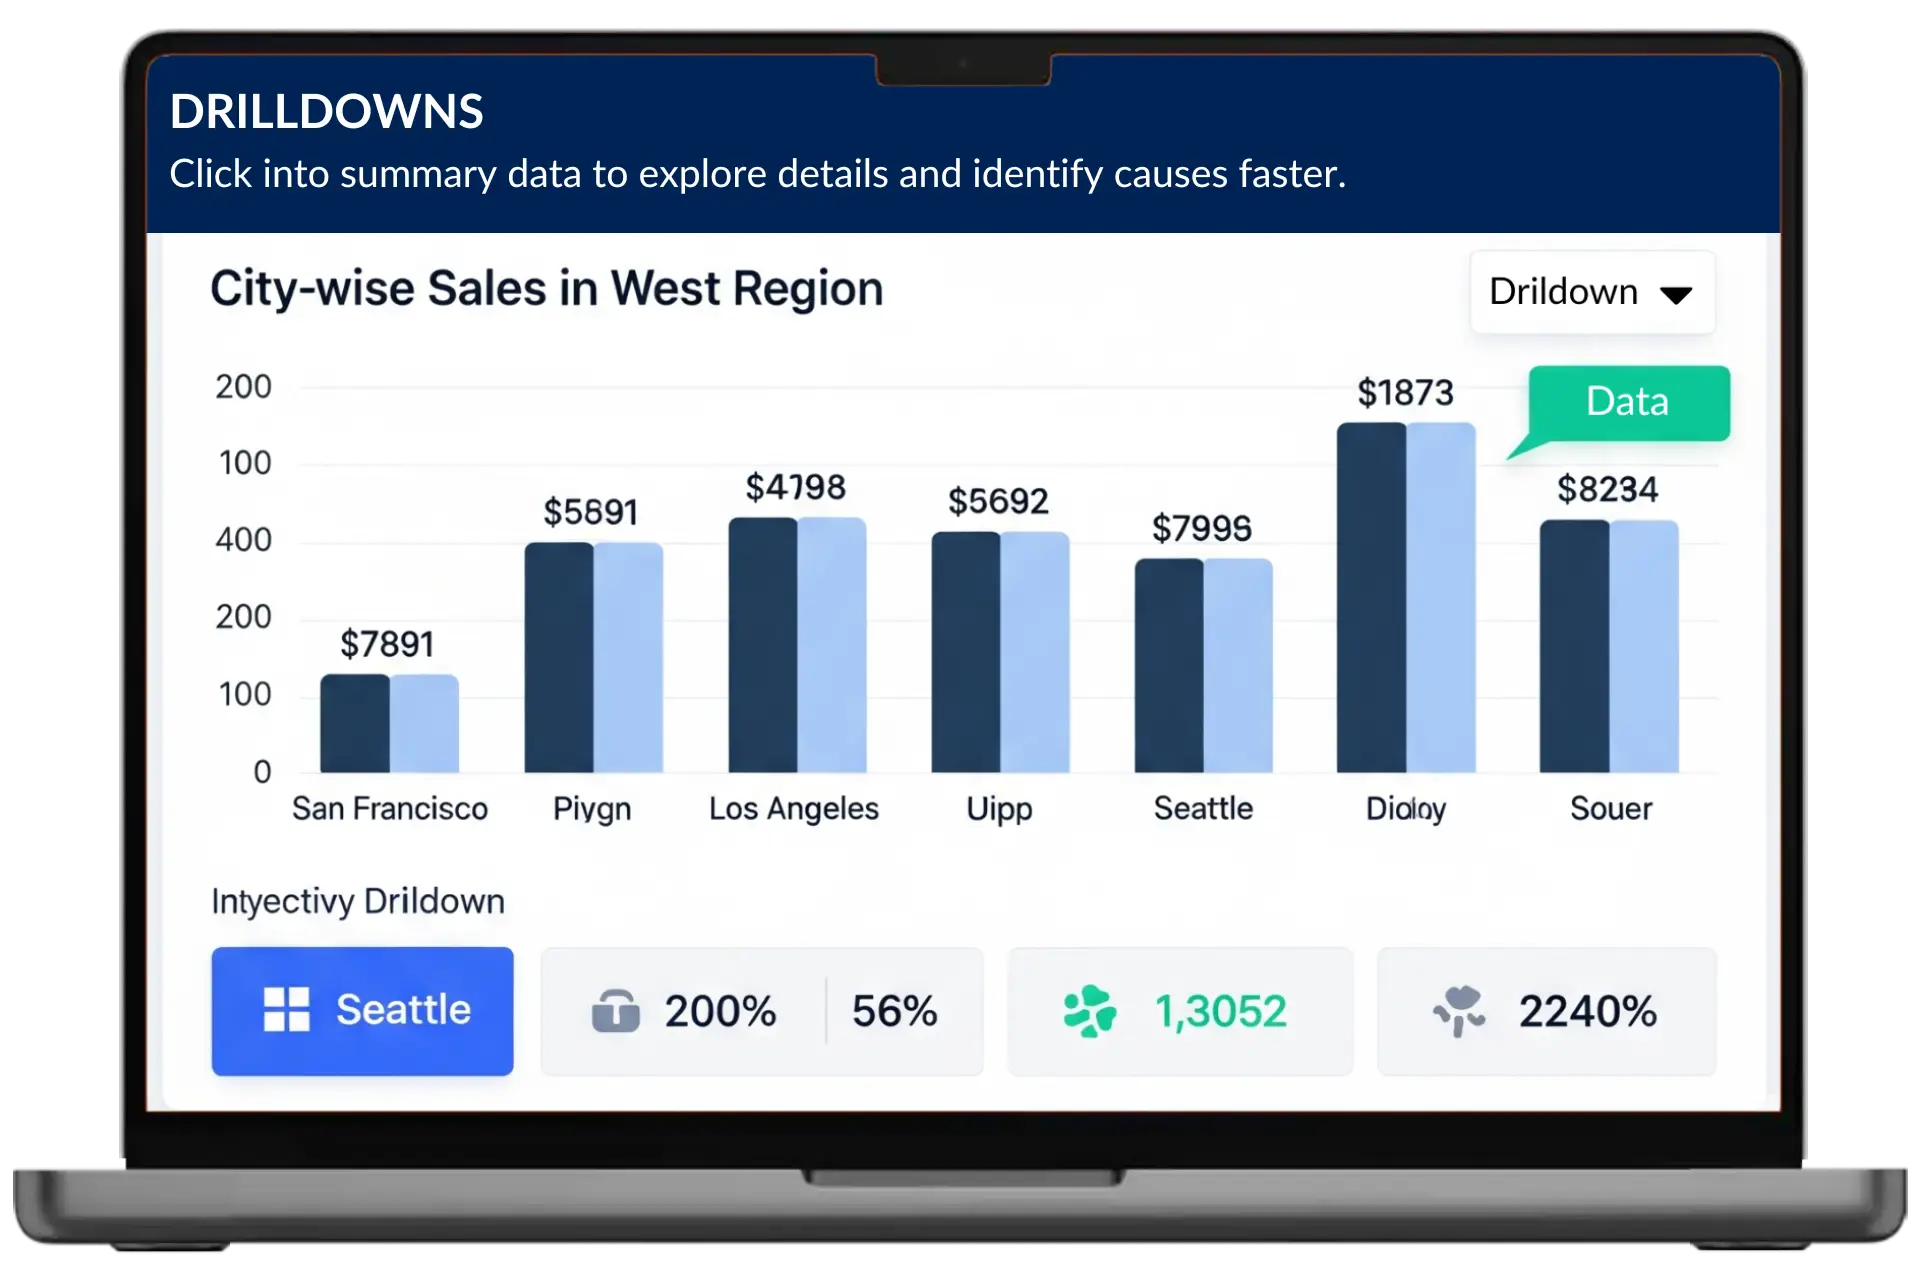
Our Power BI consulting services are designed to transform complex business data into clear, actionable insights. From custom dashboards to real-time reporting and secure data access, we provide end-to-end solutions that help businesses make smarter decisions faster.

We design dashboards tailored to your business KPIs and metrics.
Clean and structure your data for better reporting performance.

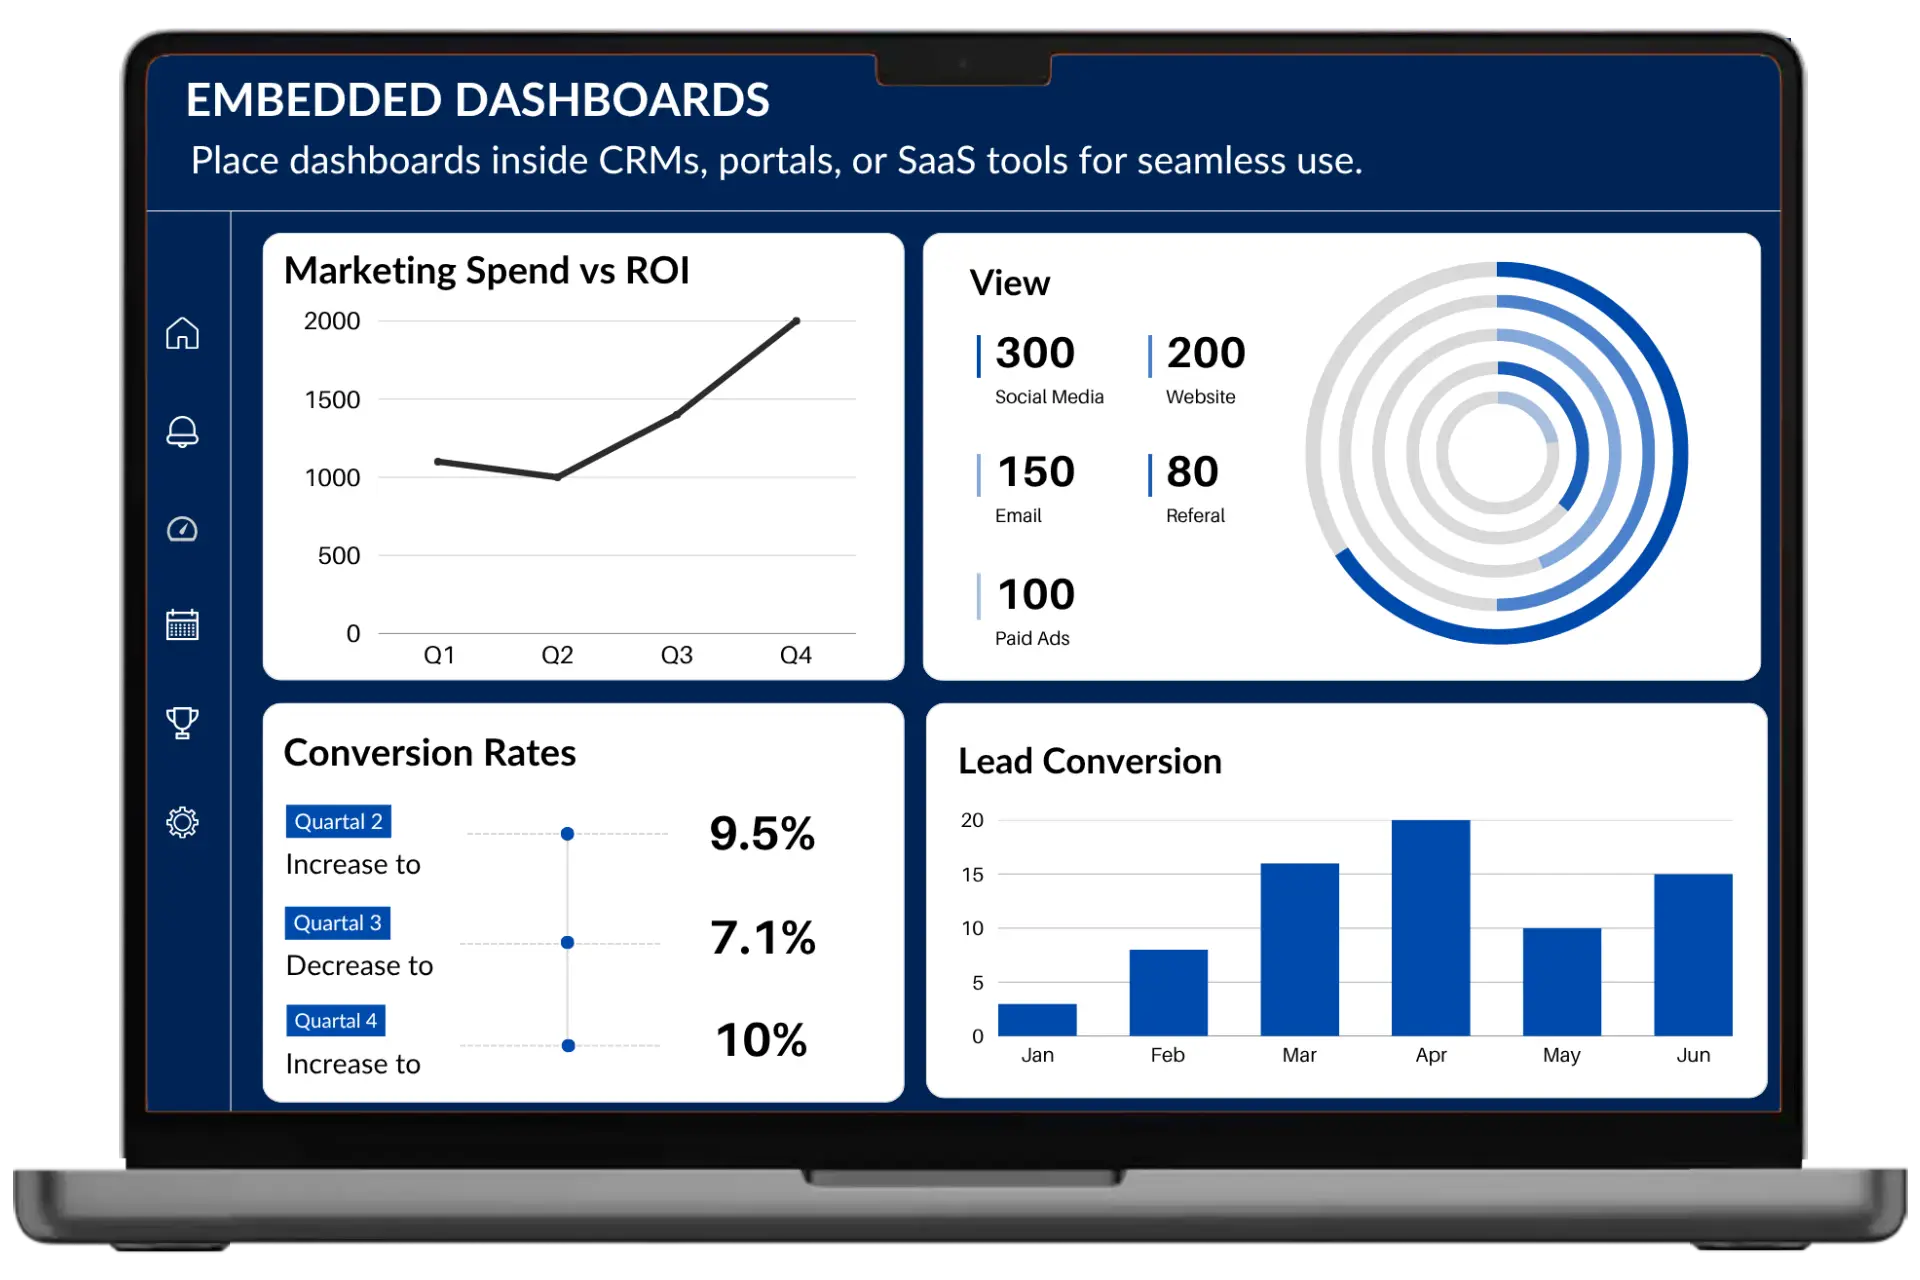
Connect Power BI with Excel, SQL Server, Google Analytics, APIs, CRM, ERP systems, and cloud platforms.

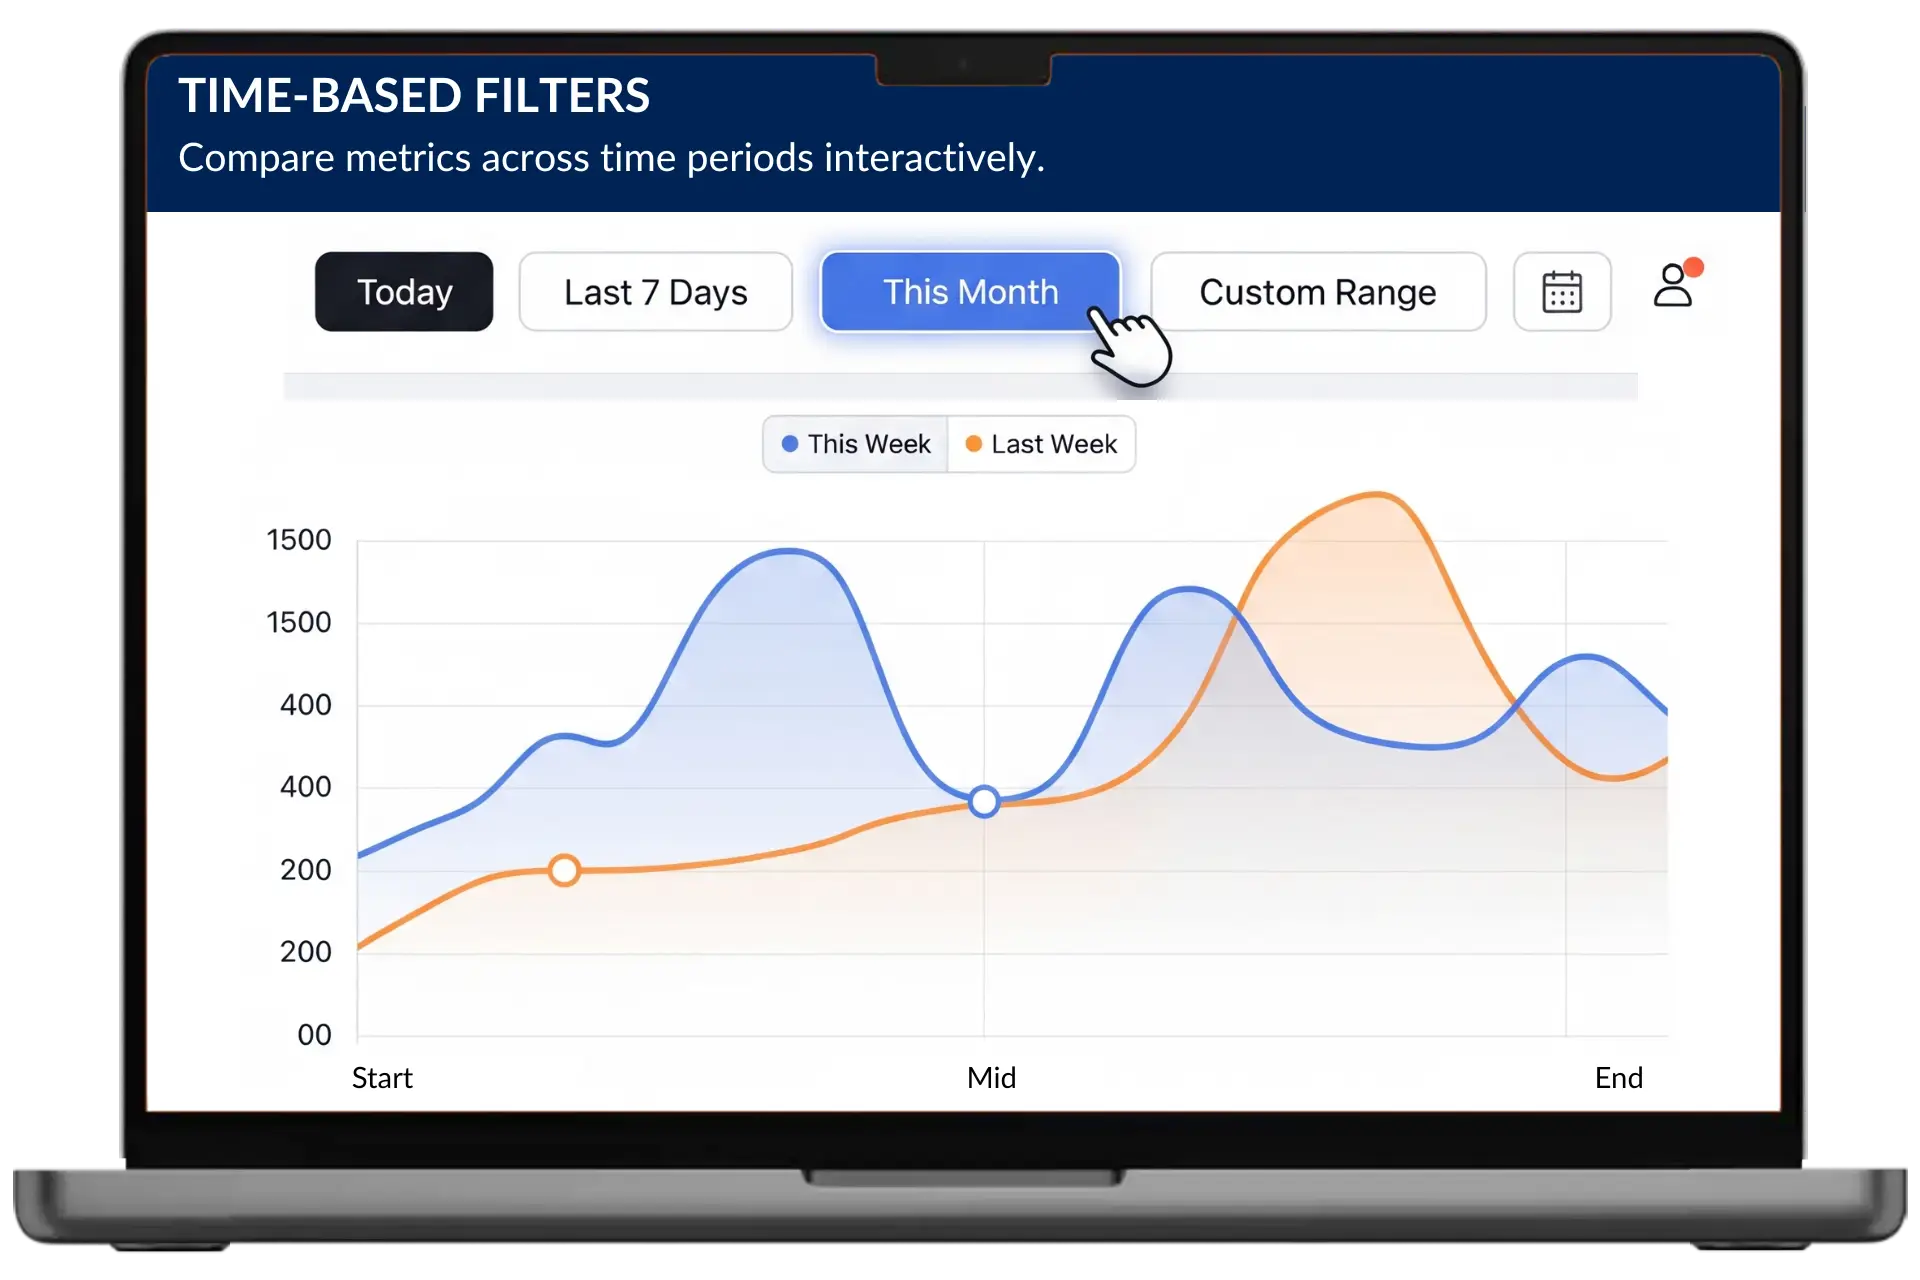
Get instant insights with live dashboards and automatic updates.

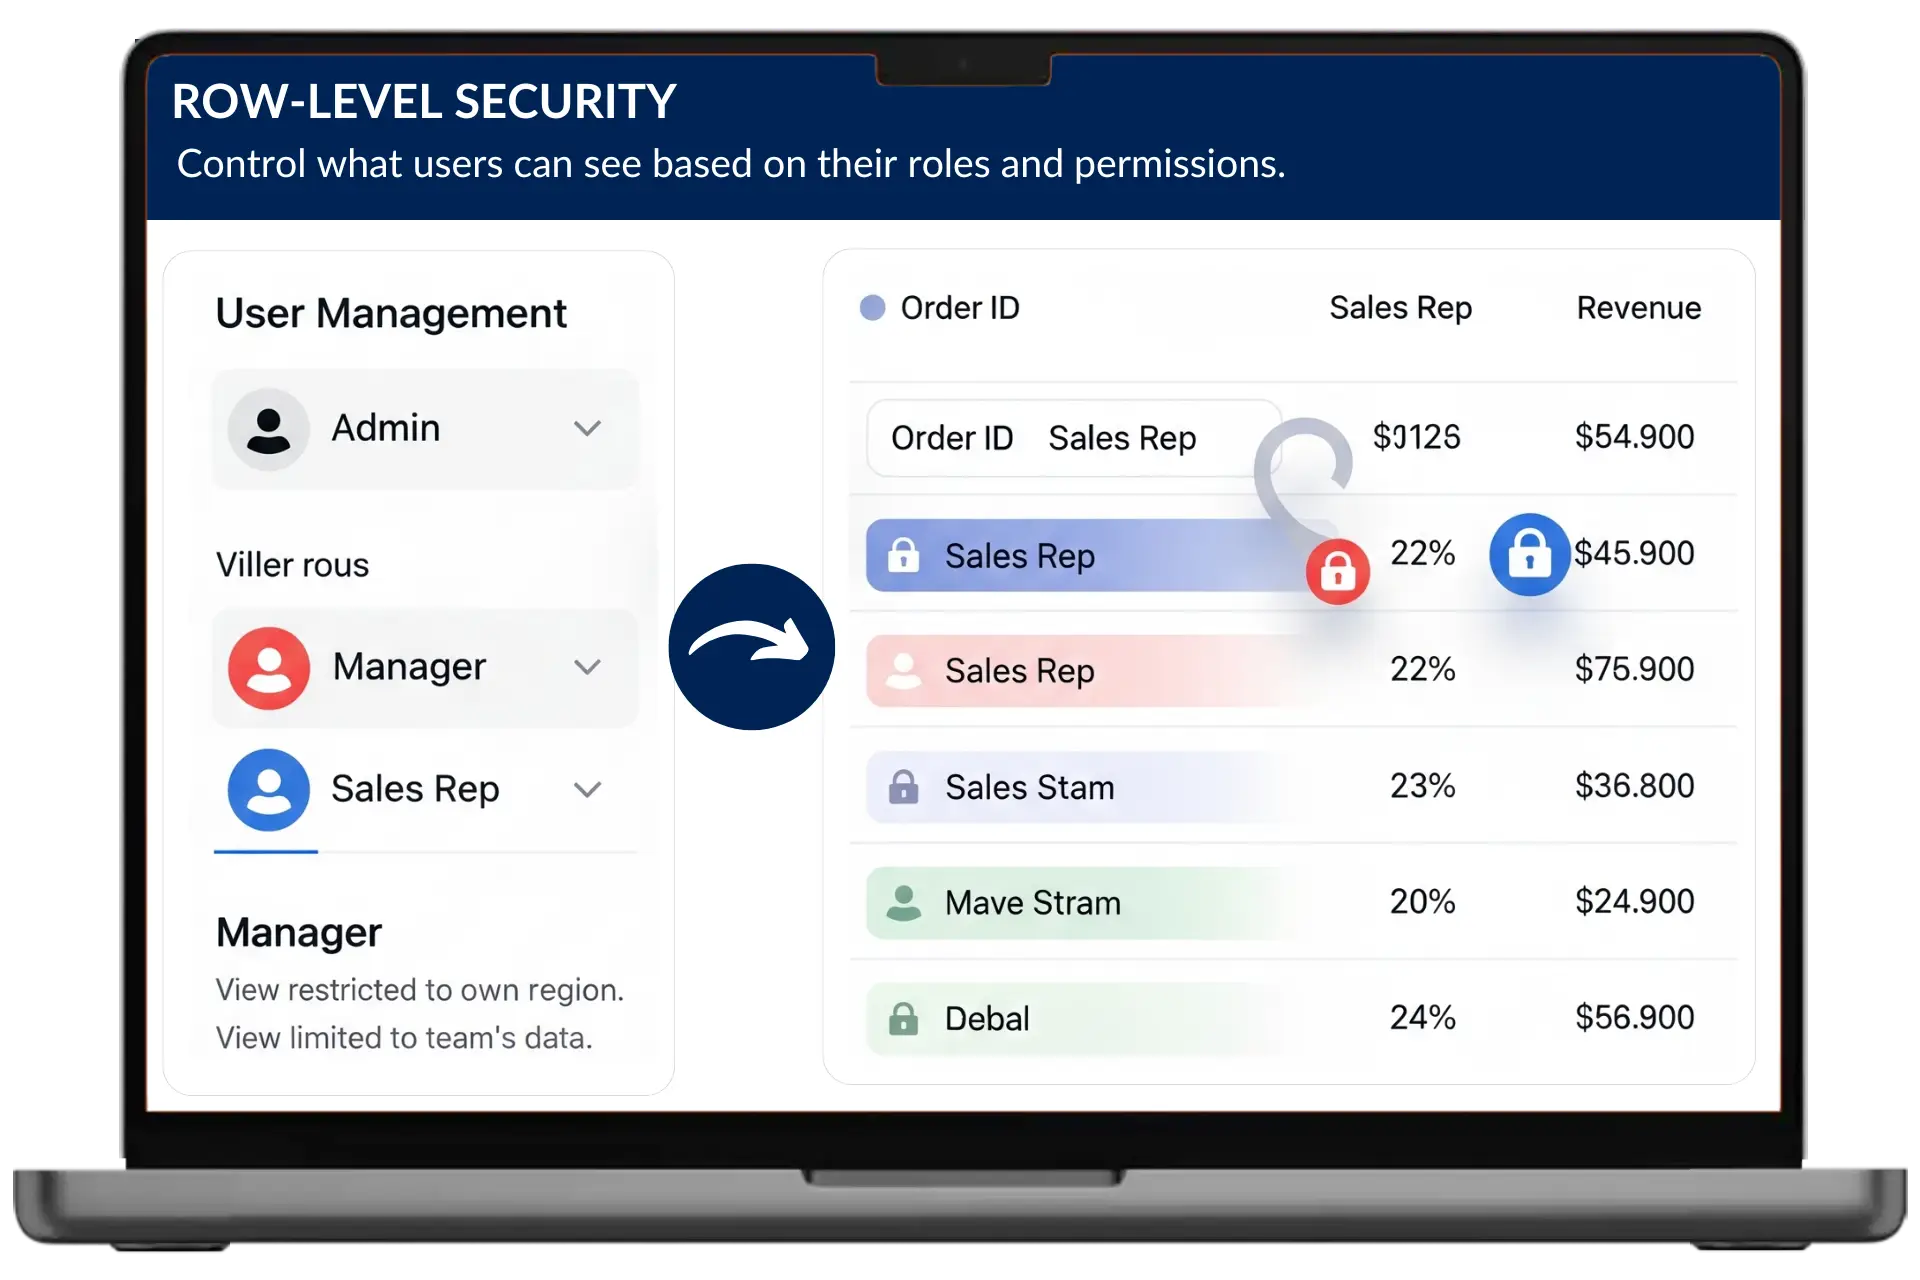
Role-based access ensures only authorized users can view sensitive data.

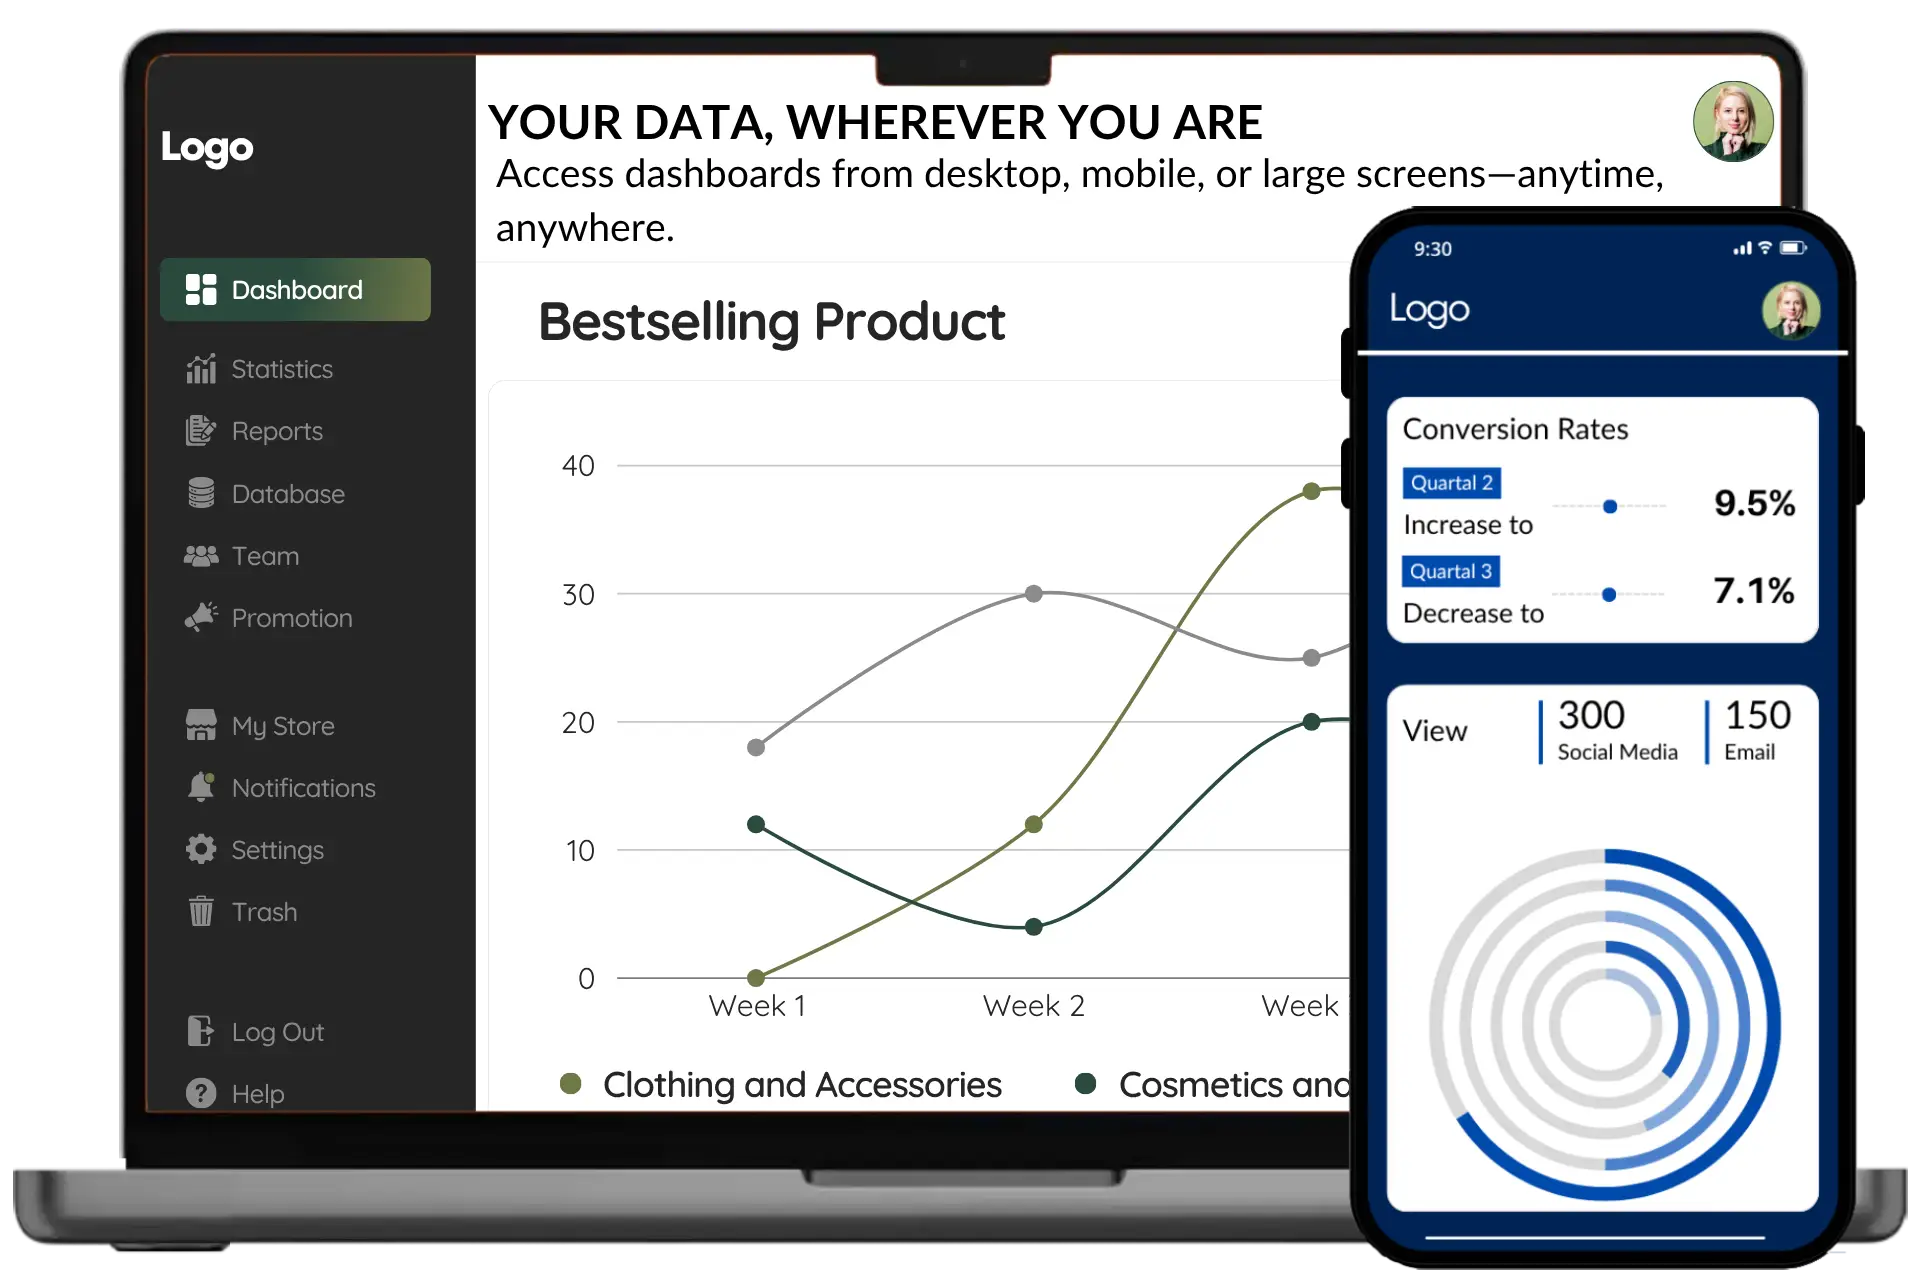
Access your dashboards anytime using Power BI cloud or mobile apps.


FAQs