Let us elevate your data storytelling and drive strategy with visuals that truly speak your business language. We offer full-spectrum data visualization services—from custom dashboard development to embedded analytics.
Get free consultation from expert data visualization consultants to define KPIs & dashboard strategy.
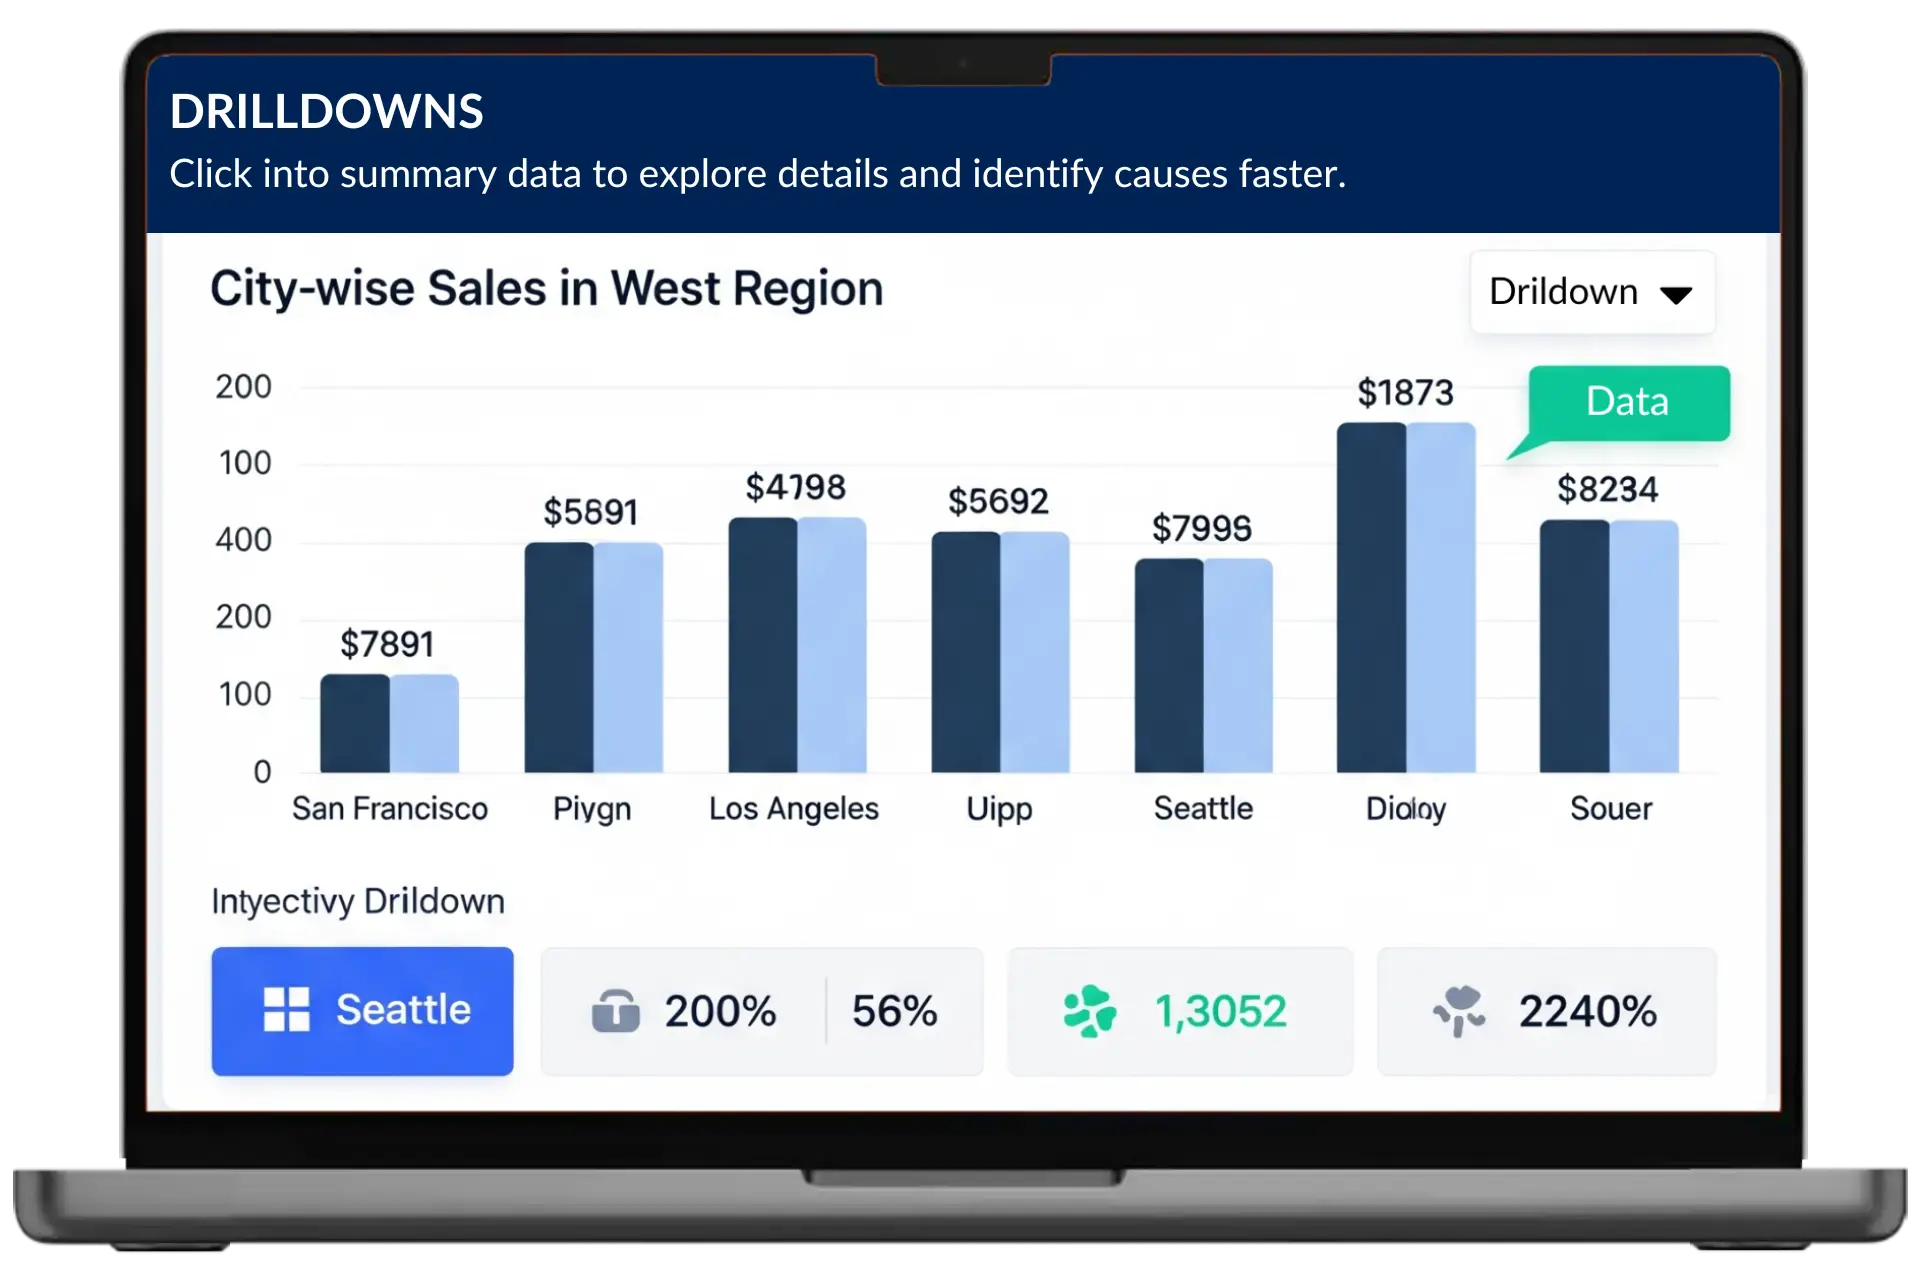
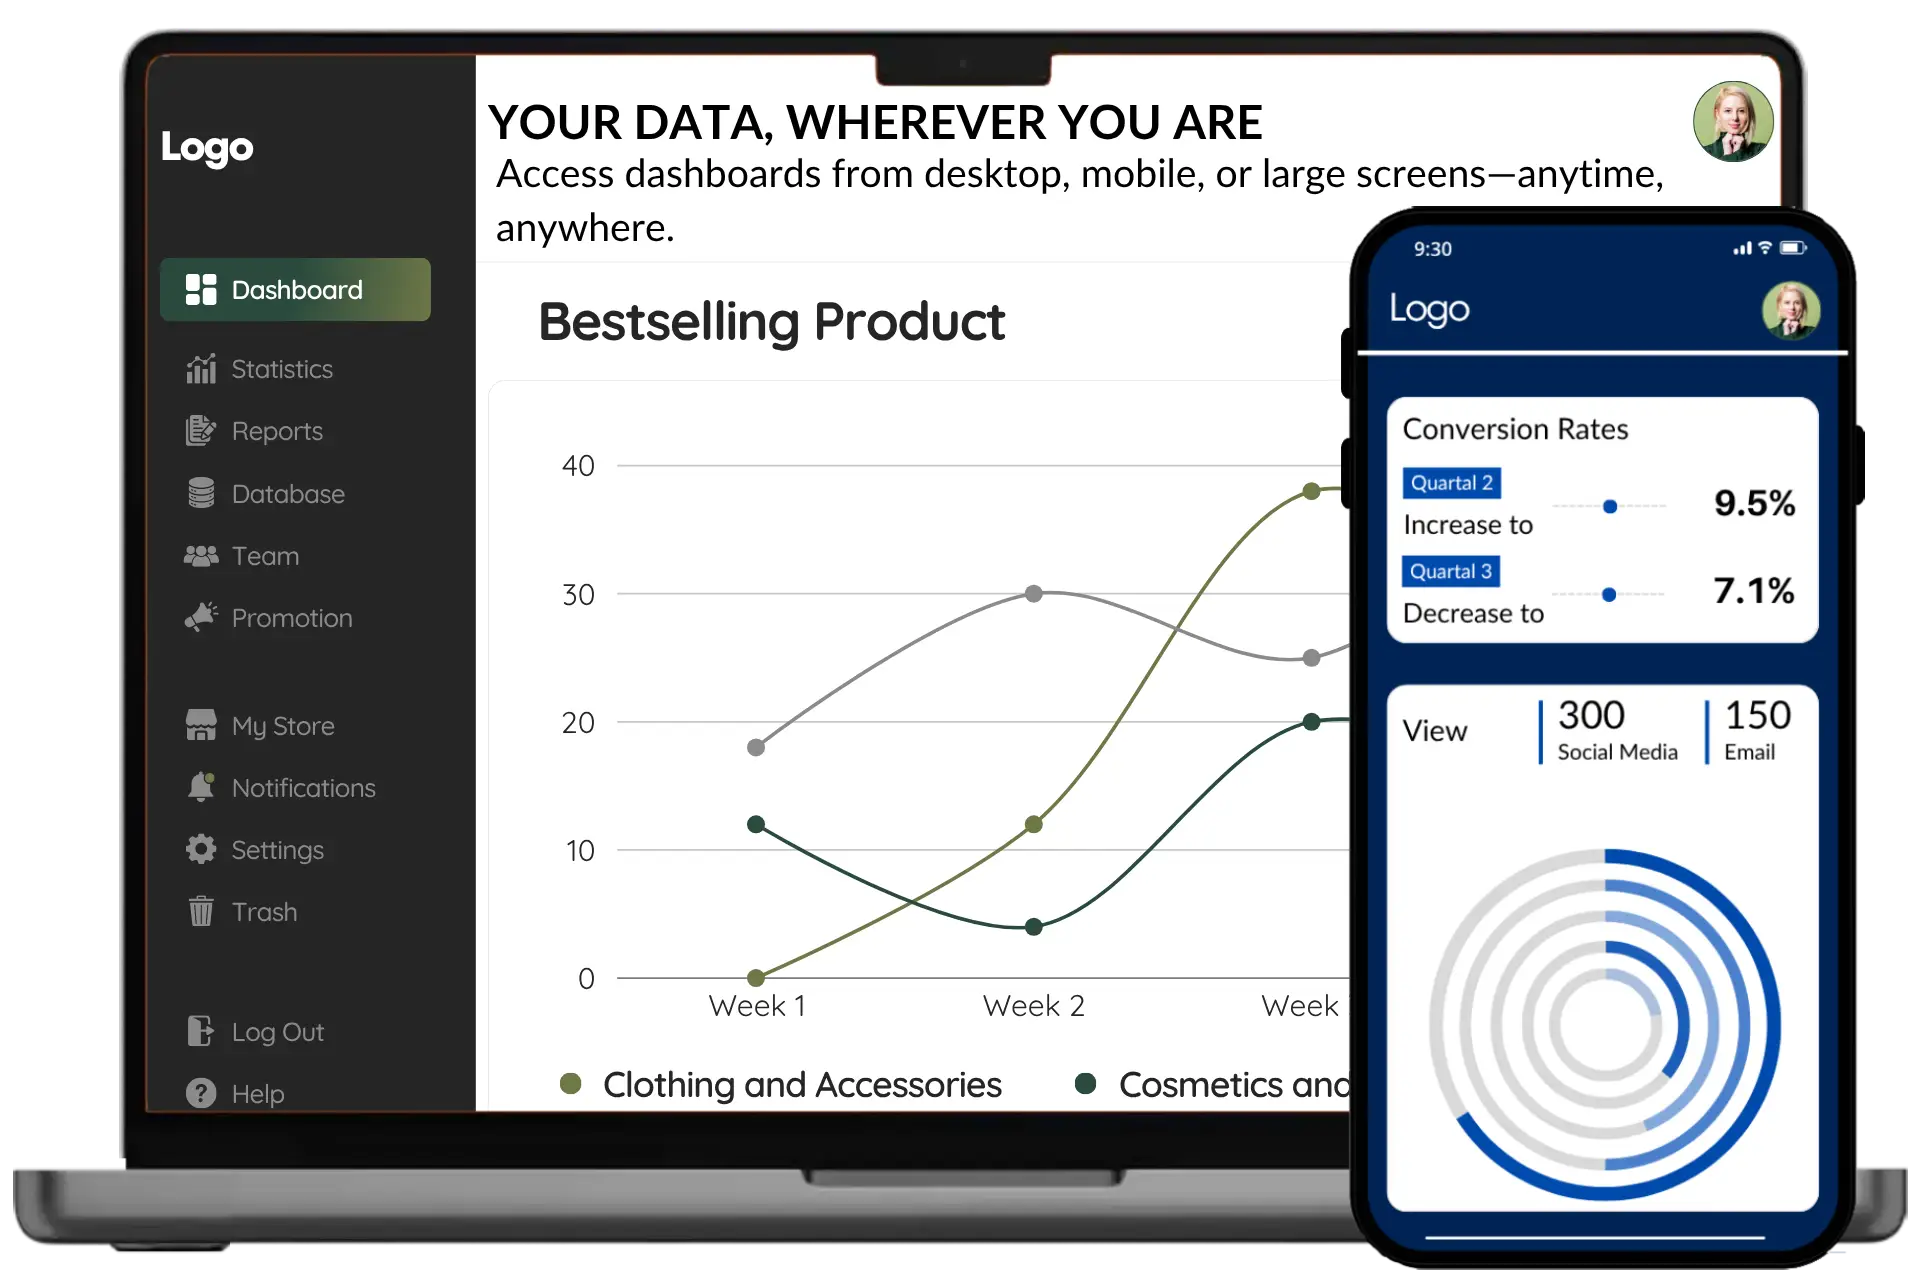
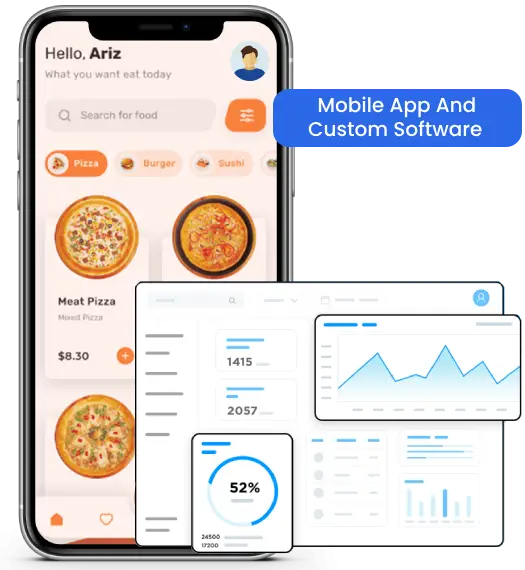
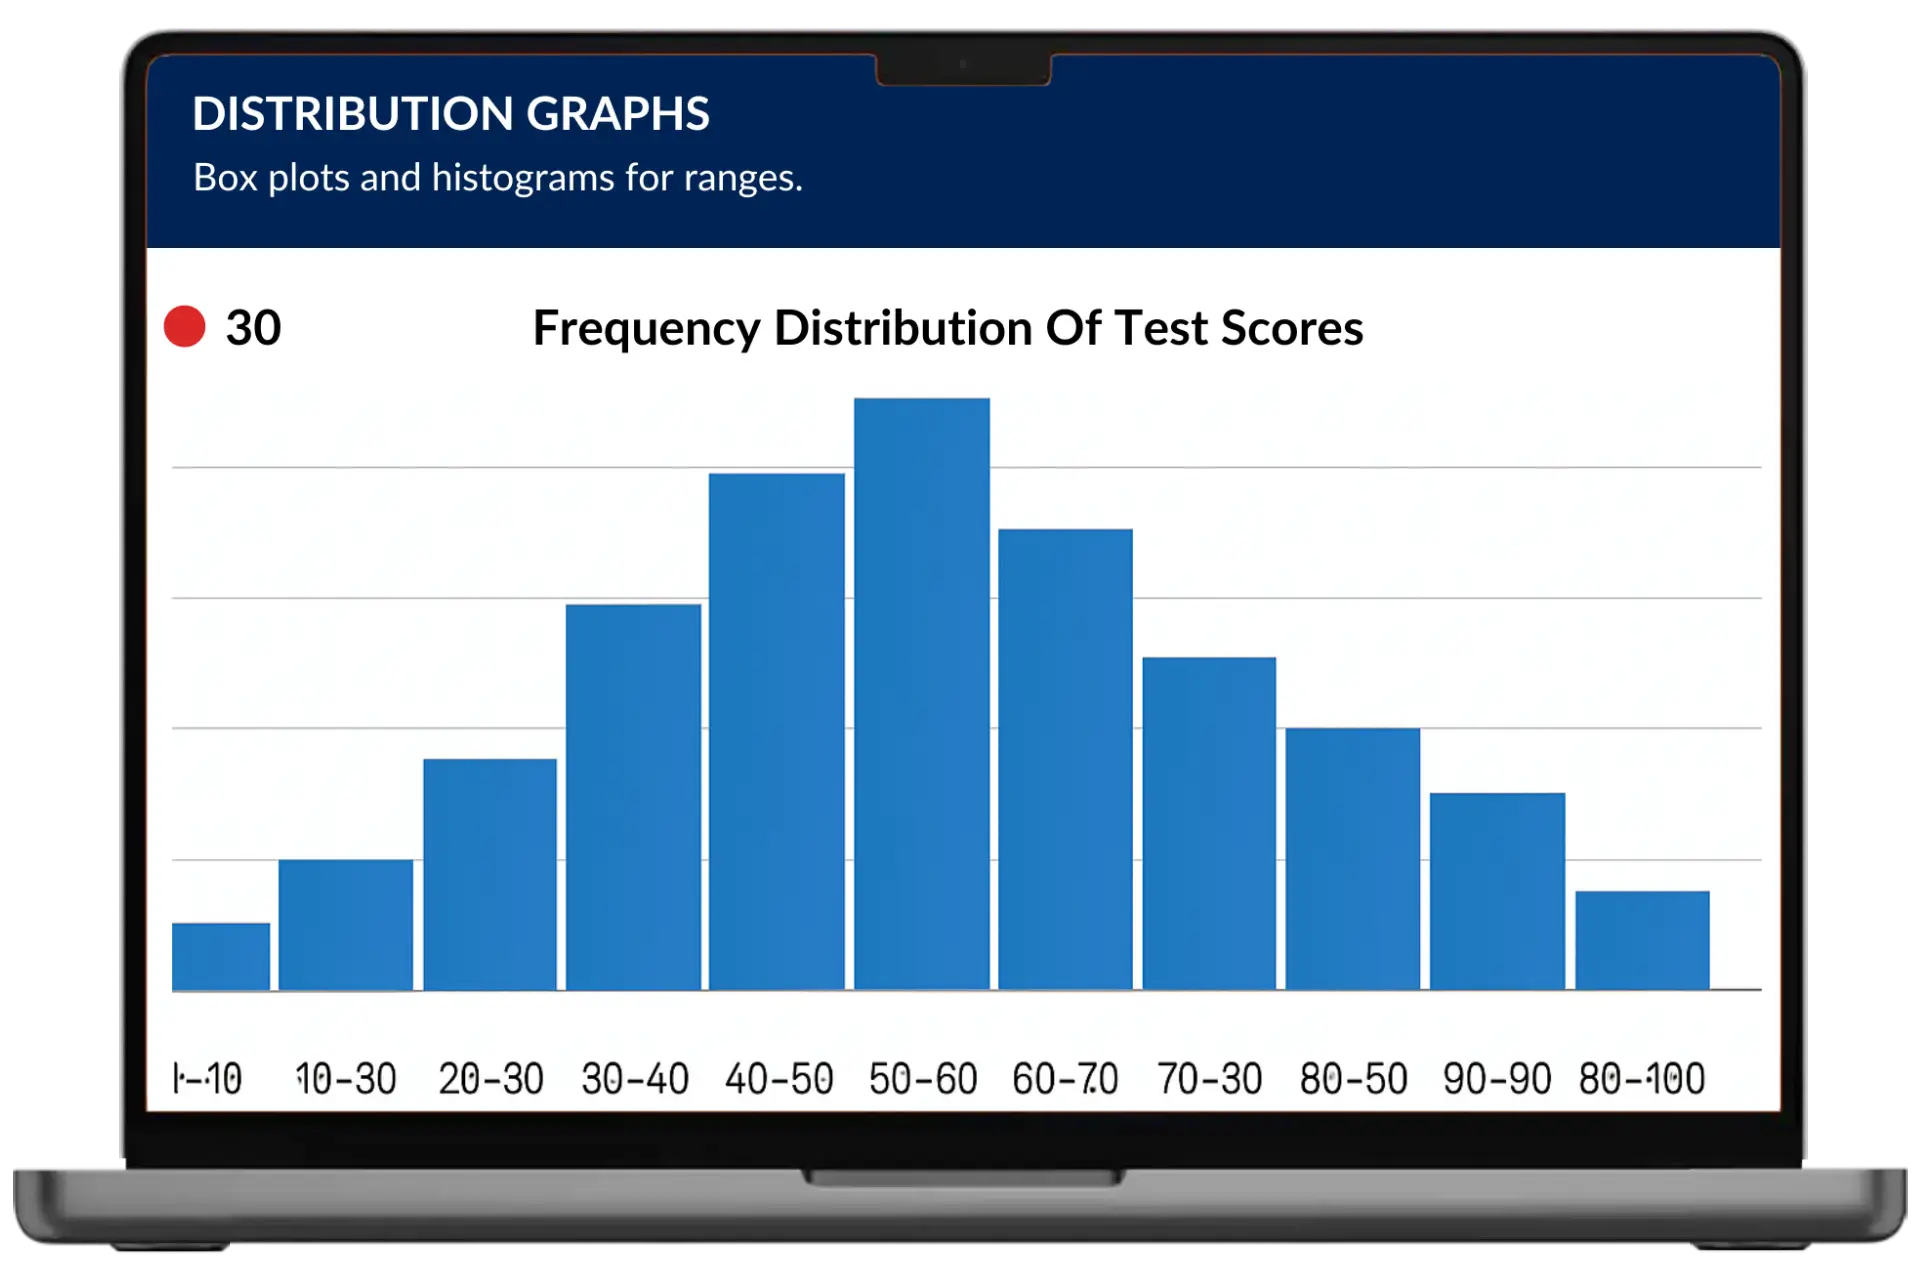
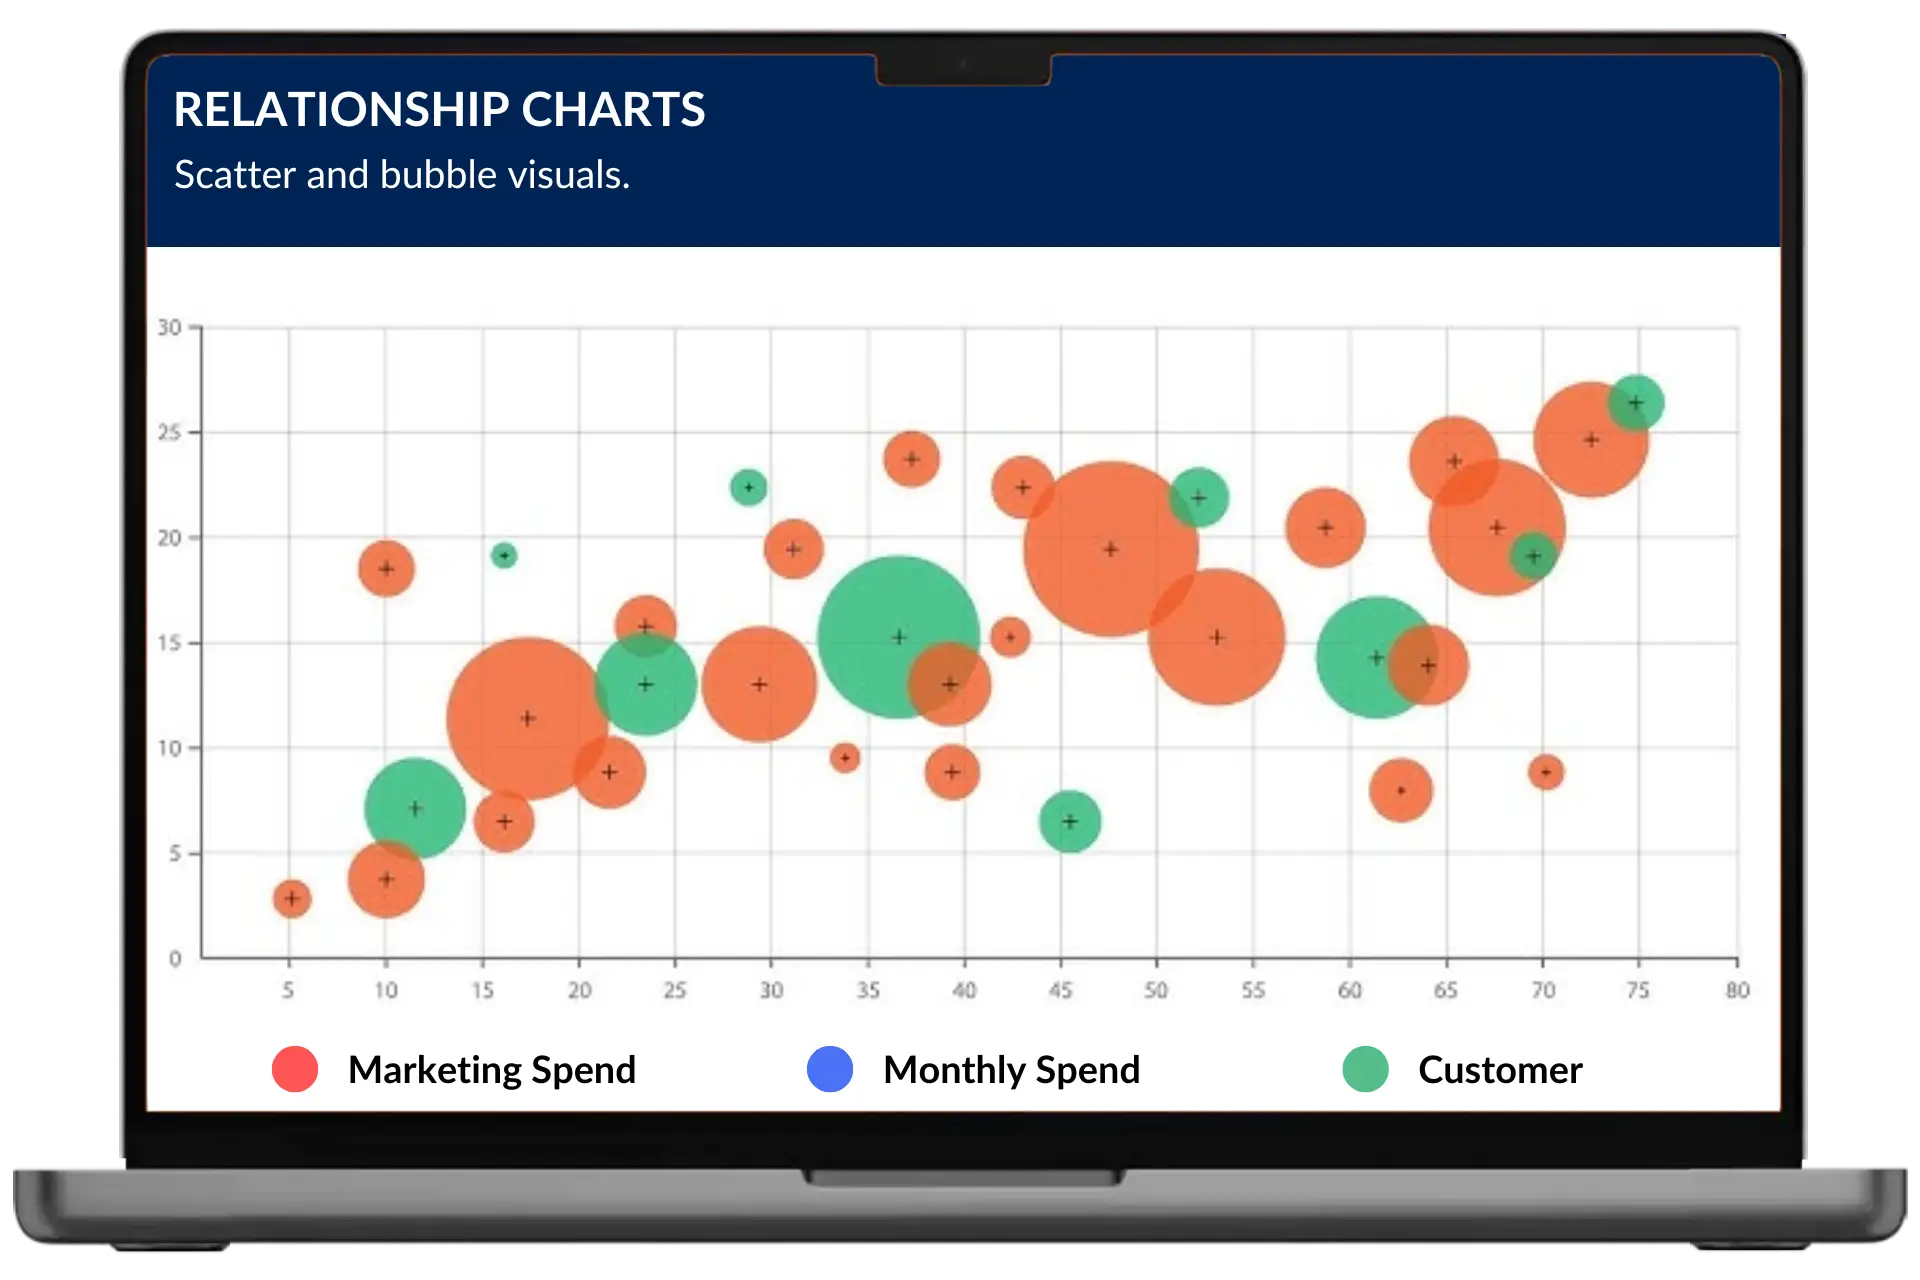
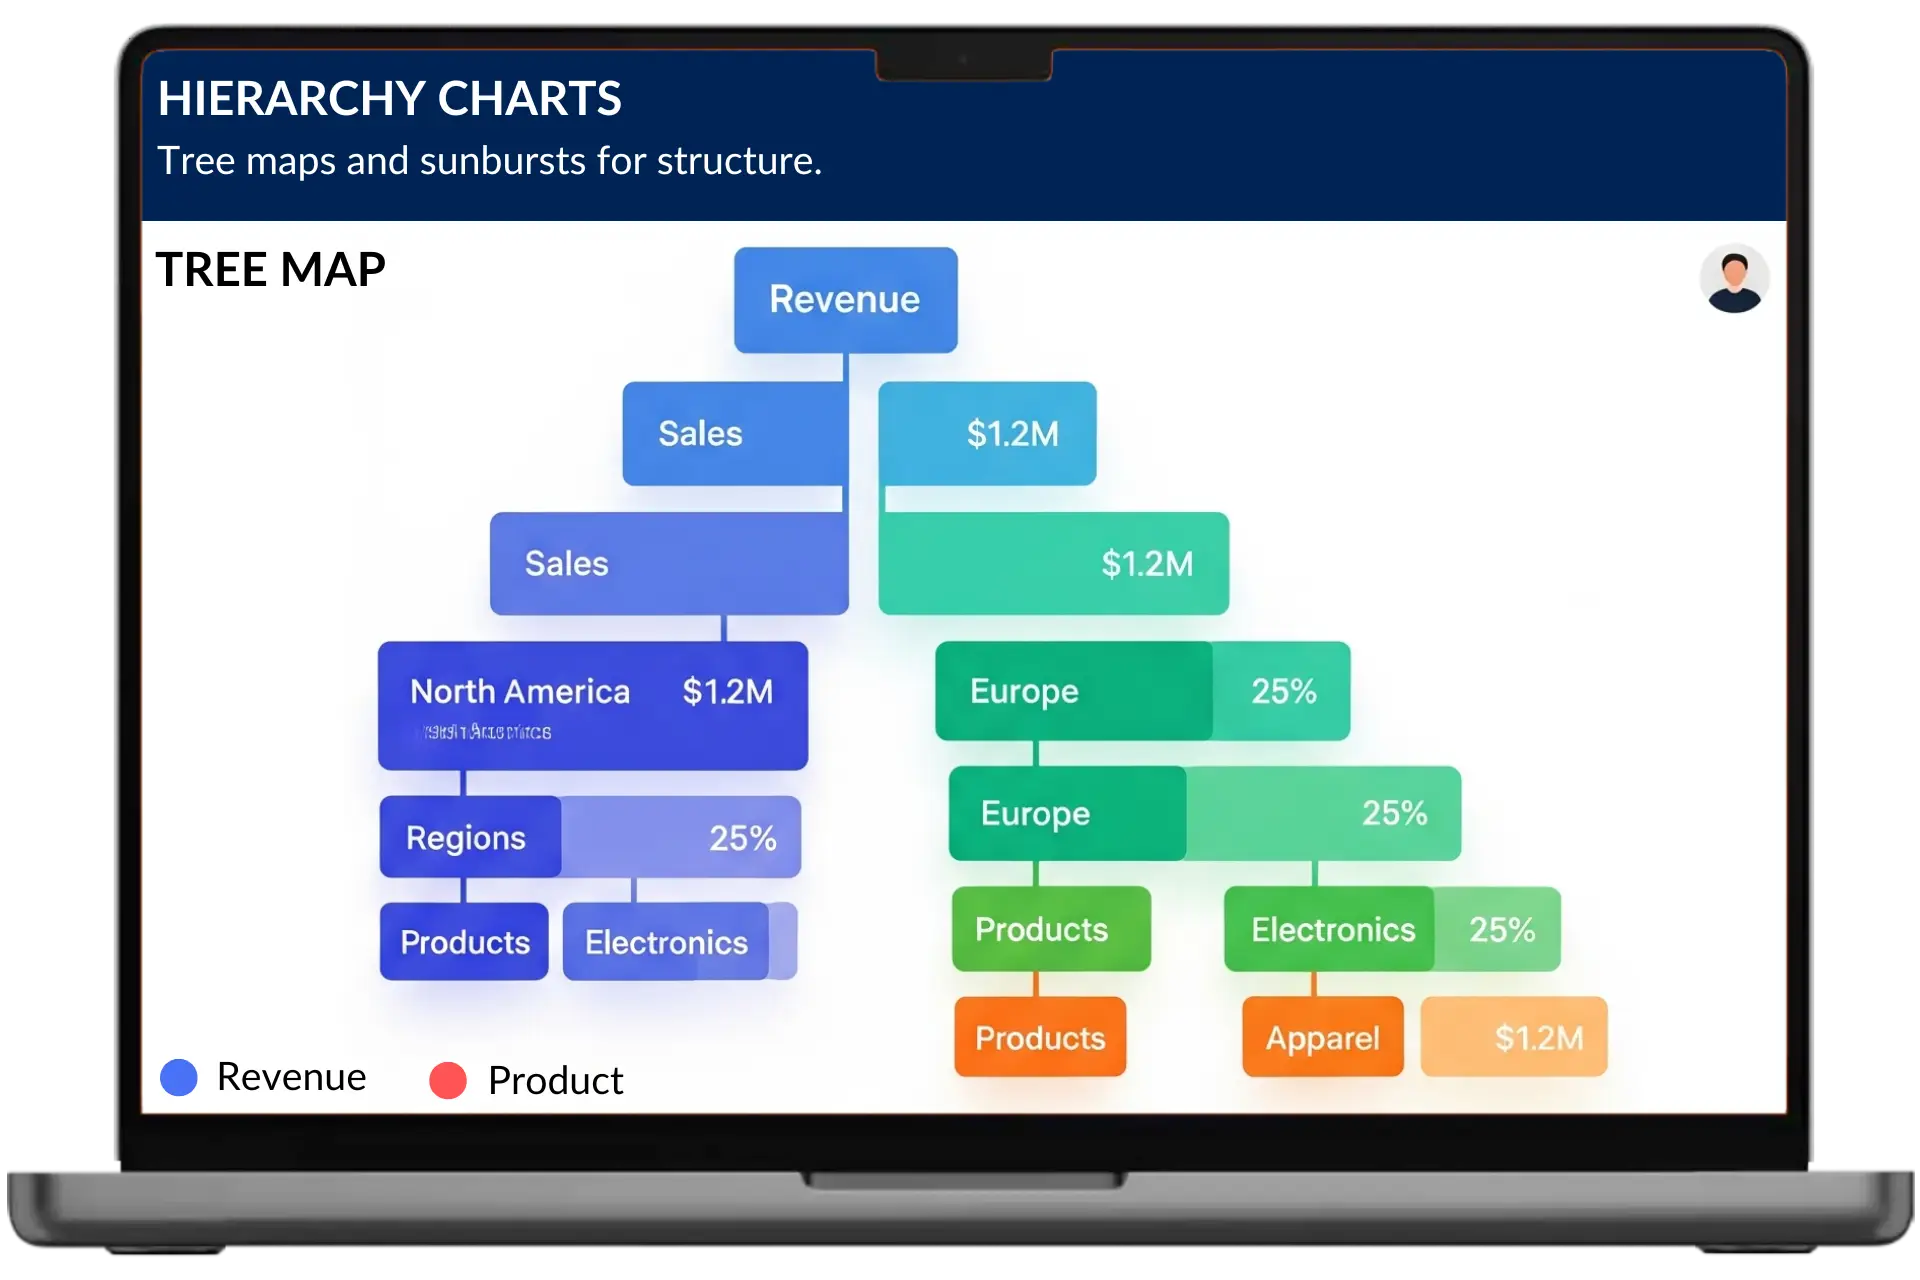
We design interactive dashboards tailored to your business KPIs, ensuring users gain instant, actionable insights.
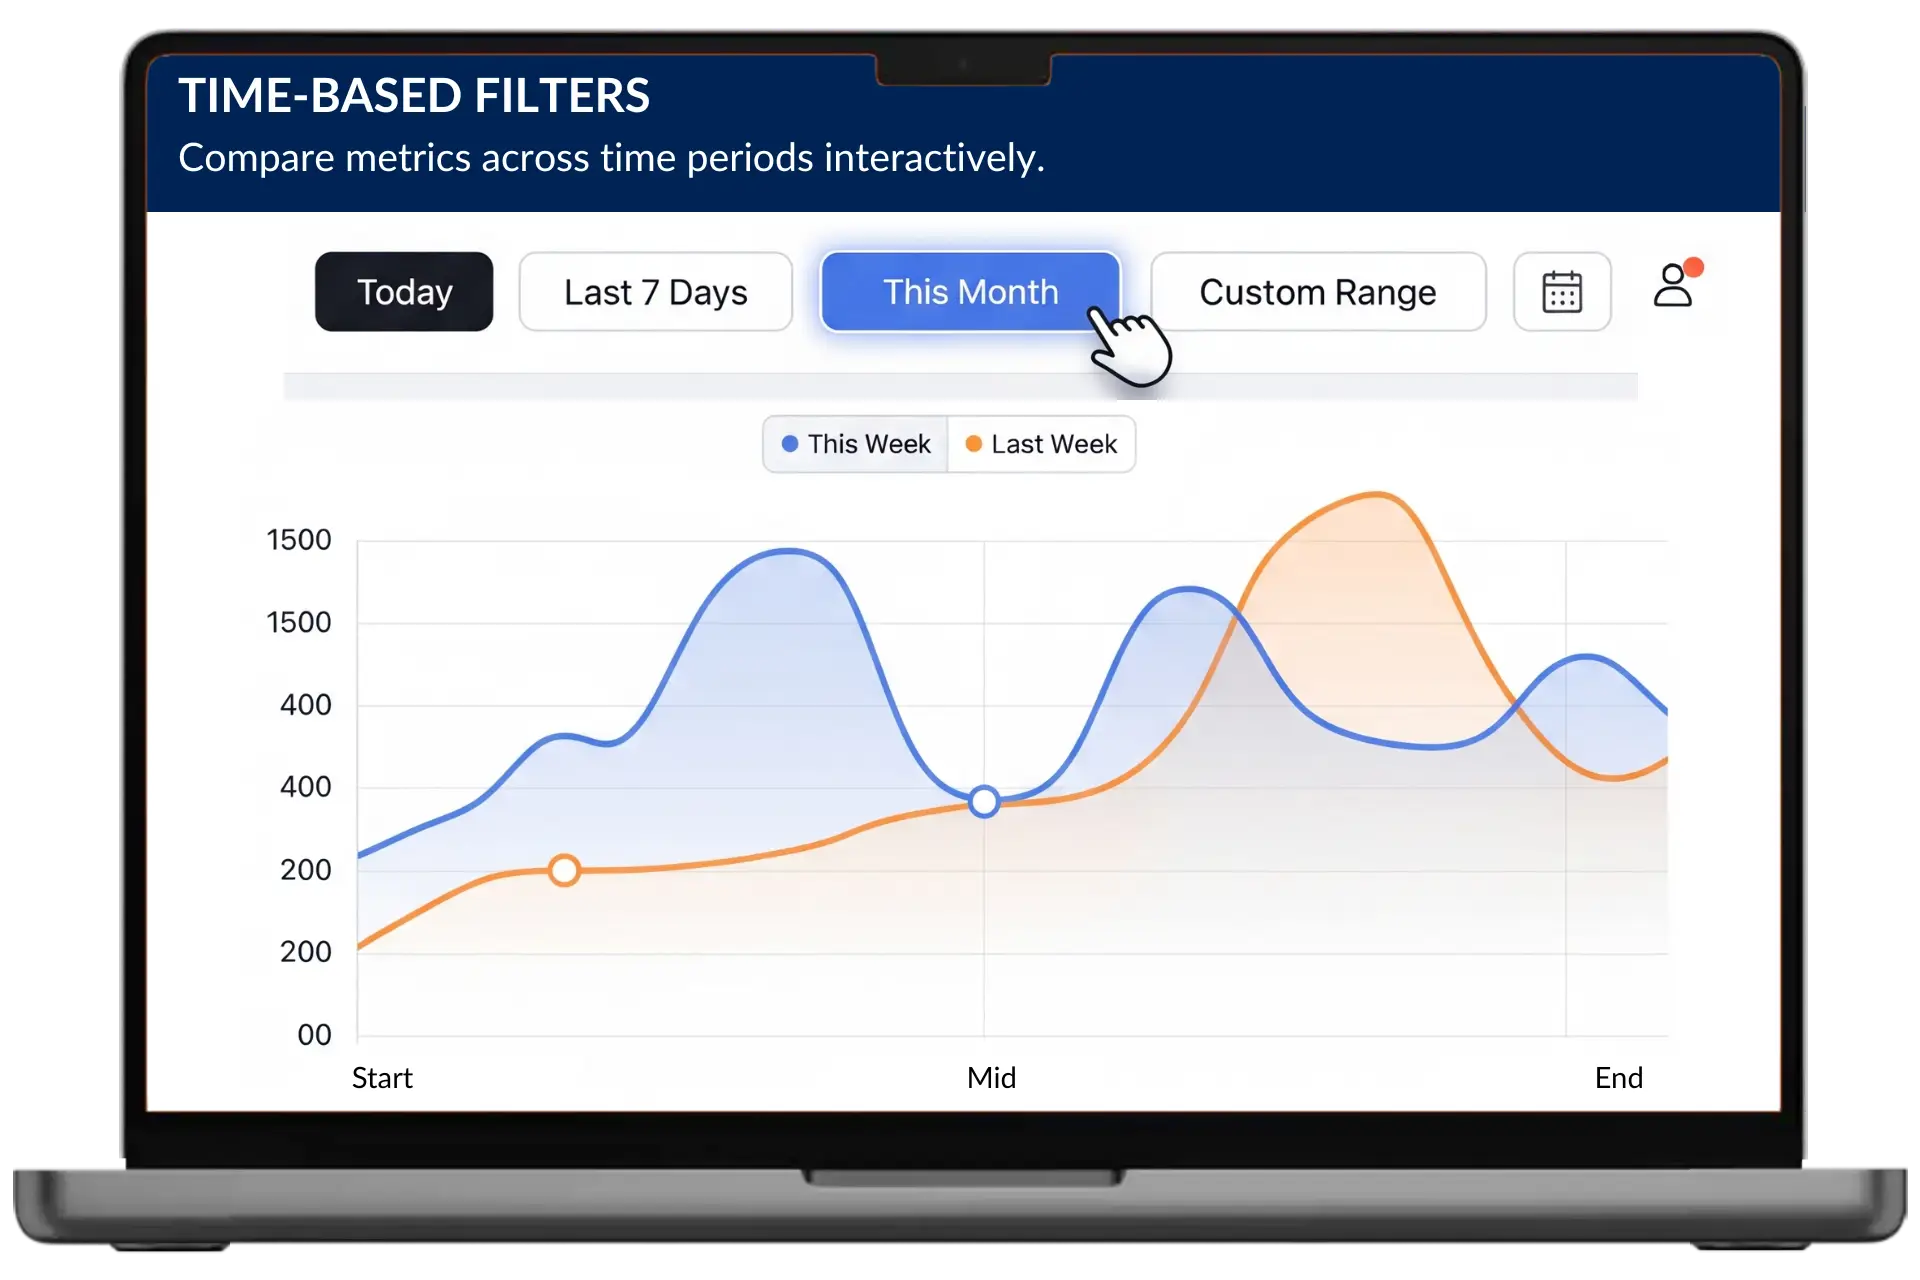
Set up scheduled or real-time reporting using leading data visualization software for fast, data-driven decisions.

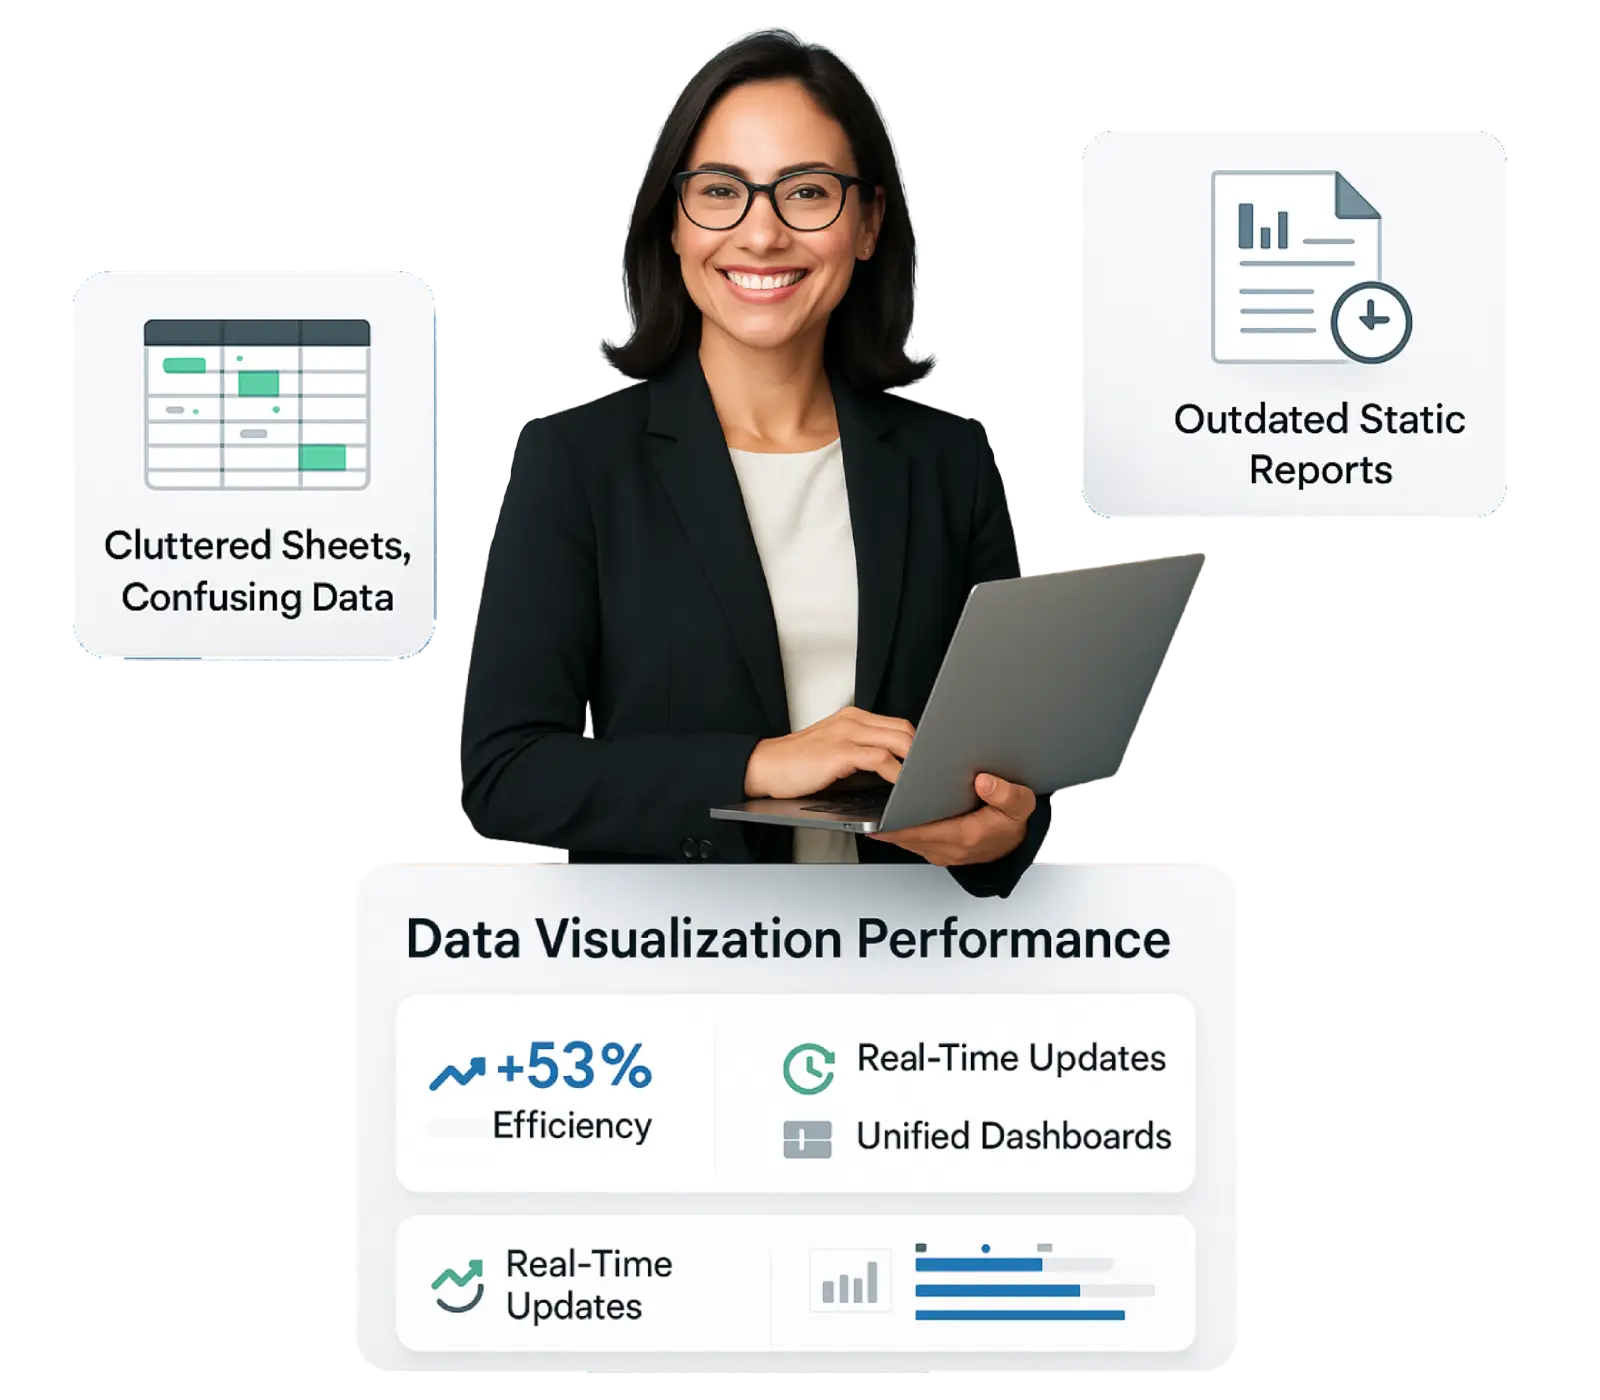
Not getting enough from your current dashboard? We revamp them for speed, clarity, and usability—ensuring every report serves a real purpose.
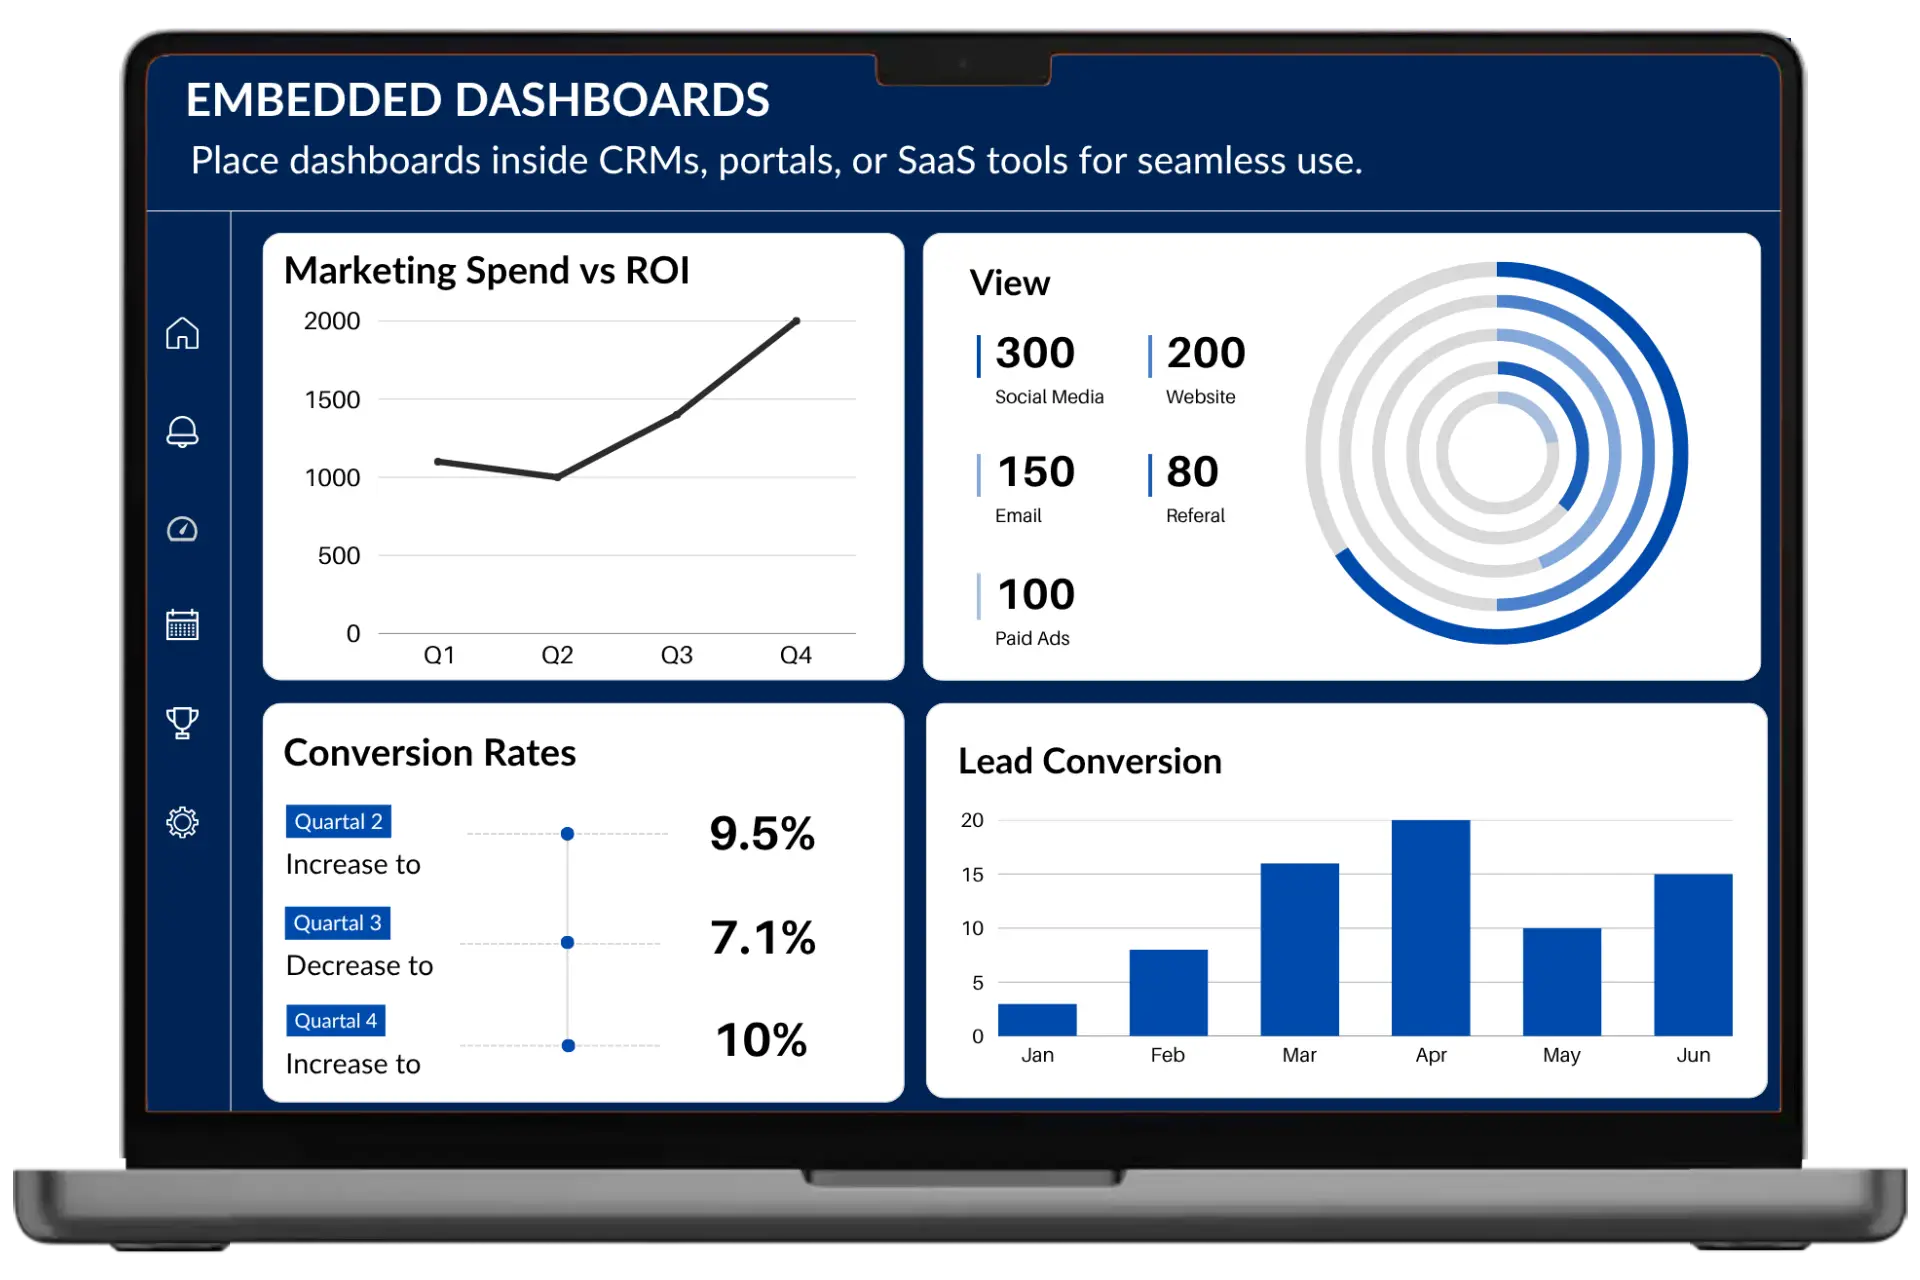
We embed visualizations directly into your existing web or mobile platforms, enabling instant, seamless data access and improved workflows.

Before visualization, we clean, blend, and structure your data to optimize every chart and dashboard.
Consulting, implementation, and support — one partner for every visualization need.

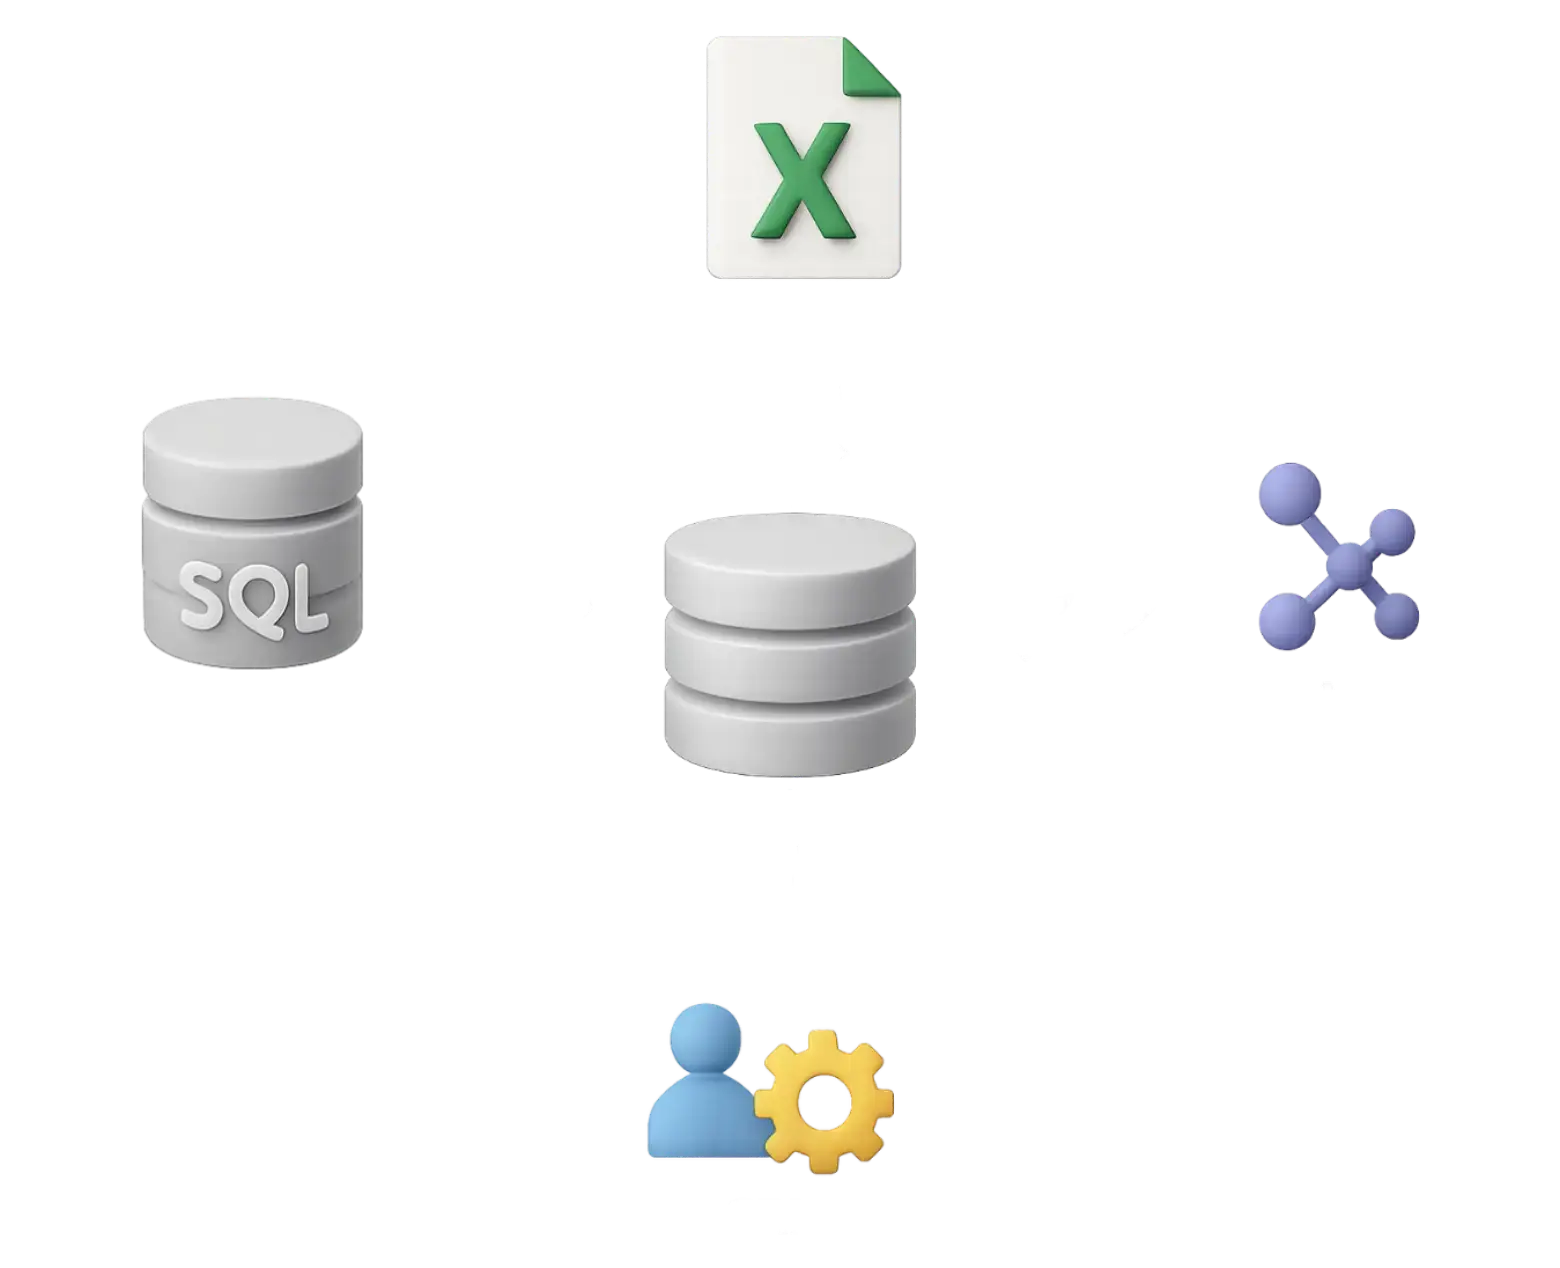
Whether it’s Excel, SQL databases, APIs, or cloud storage, we seamlessly integrate and unify your data for stunning visual reports. No more scattered insights—just one cohesive view.
![]() Power BI
Power BI
 Tableau
 Looker Studio
 D3.js
D3.js
 Highcharts
 Metabase
 Superset

We deliver fully managed dashboards with secure, scalable hosting, performance tracking, and role-based access control. Our service ensures your data visualizations are always accessible, optimized, and tailored to your team’s needs without the hassle of in-house management.
We follow a structured, transparent, and collaborative approach to turn raw data into impactful visual stories that drive real business value.
We understand your business objectives and KPIs.
Connect all your data systems securely.
Share visual layouts for feedback before build.
Build and test dashboards using the chosen tech.
Go live and receive ongoing help and training.
Discover dashboards we’ve built, turning complex data into clear, actionable insights for smarter decisions.

We developed this interactive dashboard to track the execution performance of multiple products and services across global regions. It presents visibility into bookings vs. forecast, quarterly targets, sales funnel health, and financial KPIs such as forecast accuracy and plan achievement.
Designed for executive and sales leadership, the dashboard empowers decision-makers to compare actual vs. committed values, spot underperforming markets, and align efforts with quarterly and yearly goals.
Key Features:
Waterfall Conversion Dashboard to help marketing teams measure campaign effectiveness across global regions. Built using Tableau, it visualizes the end-to-end journey from MQL (Marketing Qualified Leads) to final conversions (WON), enabling stakeholders to understand funnel drop-offs and improve decision-making.
Key Capabilities:


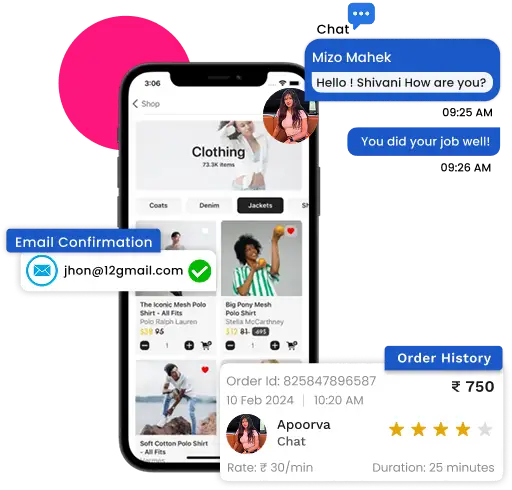
We created a comprehensive dashboard for a nonprofit organization focused on maternal and child health. The dashboard consolidated historical data from Facebook and website analytics to visualize key engagement metrics, such as video reach, user interactions, and demographic trends. It helped the client better understand their audience behaviour and optimize content for stronger digital outreach.
Key Features:
As a leading data visualization services provider, we hold around a decade of experience in crafting customized data systems. We combine technical mastery, business understanding, and responsive support—making us a top data visualization company dedicated to custom, client-focused, and results-driven solutions.
01
We offer a no-cost consultation to understand your goals and provide a clear, obligation-free estimate tailored to your project requirements.
02
With over a decade of experience, we’ve helped businesses simplify complex data and make informed decisions through consistent, insight-driven visual solutions.
03
Our certified experts bring hands-on experience across industries, delivering readable, accurate visuals from large datasets using graphs, charts, maps, and tables.
04
From encryption to access control, we build solutions that prioritize safety and compliance.
05
We provide 24/7 support and regular maintenance to prevent issues, ensure smooth updates, and keep your data visualizations running without interruption.
06
Frequent updates, clear communication, and adaptive development ensure your project meets business needs precisely.
Whether you’re looking for a trusted data visualization agency, a flexible data visualization consultant, or data visualization as a service, Dreamer Technoland has you covered. We combine domain experience, security-first development, and intuitive designs—making us a reliable data visualization service provider for businesses that want results.

Choosing the right data visualization software depends on your business goals, data sources, user roles, and reporting needs. It’s important to evaluate tools based on integration capability, ease of use, scalability, and visualization options that match your workflow.
Yes. Our data visualization services are fully integrable with ERPs, CRMs, and cloud storage. We ensure a seamless flow between your data sources and dashboards, eliminating silos and boosting visibility.
Yes, we use APIs and data streams to power dashboards that update automatically with the latest data.
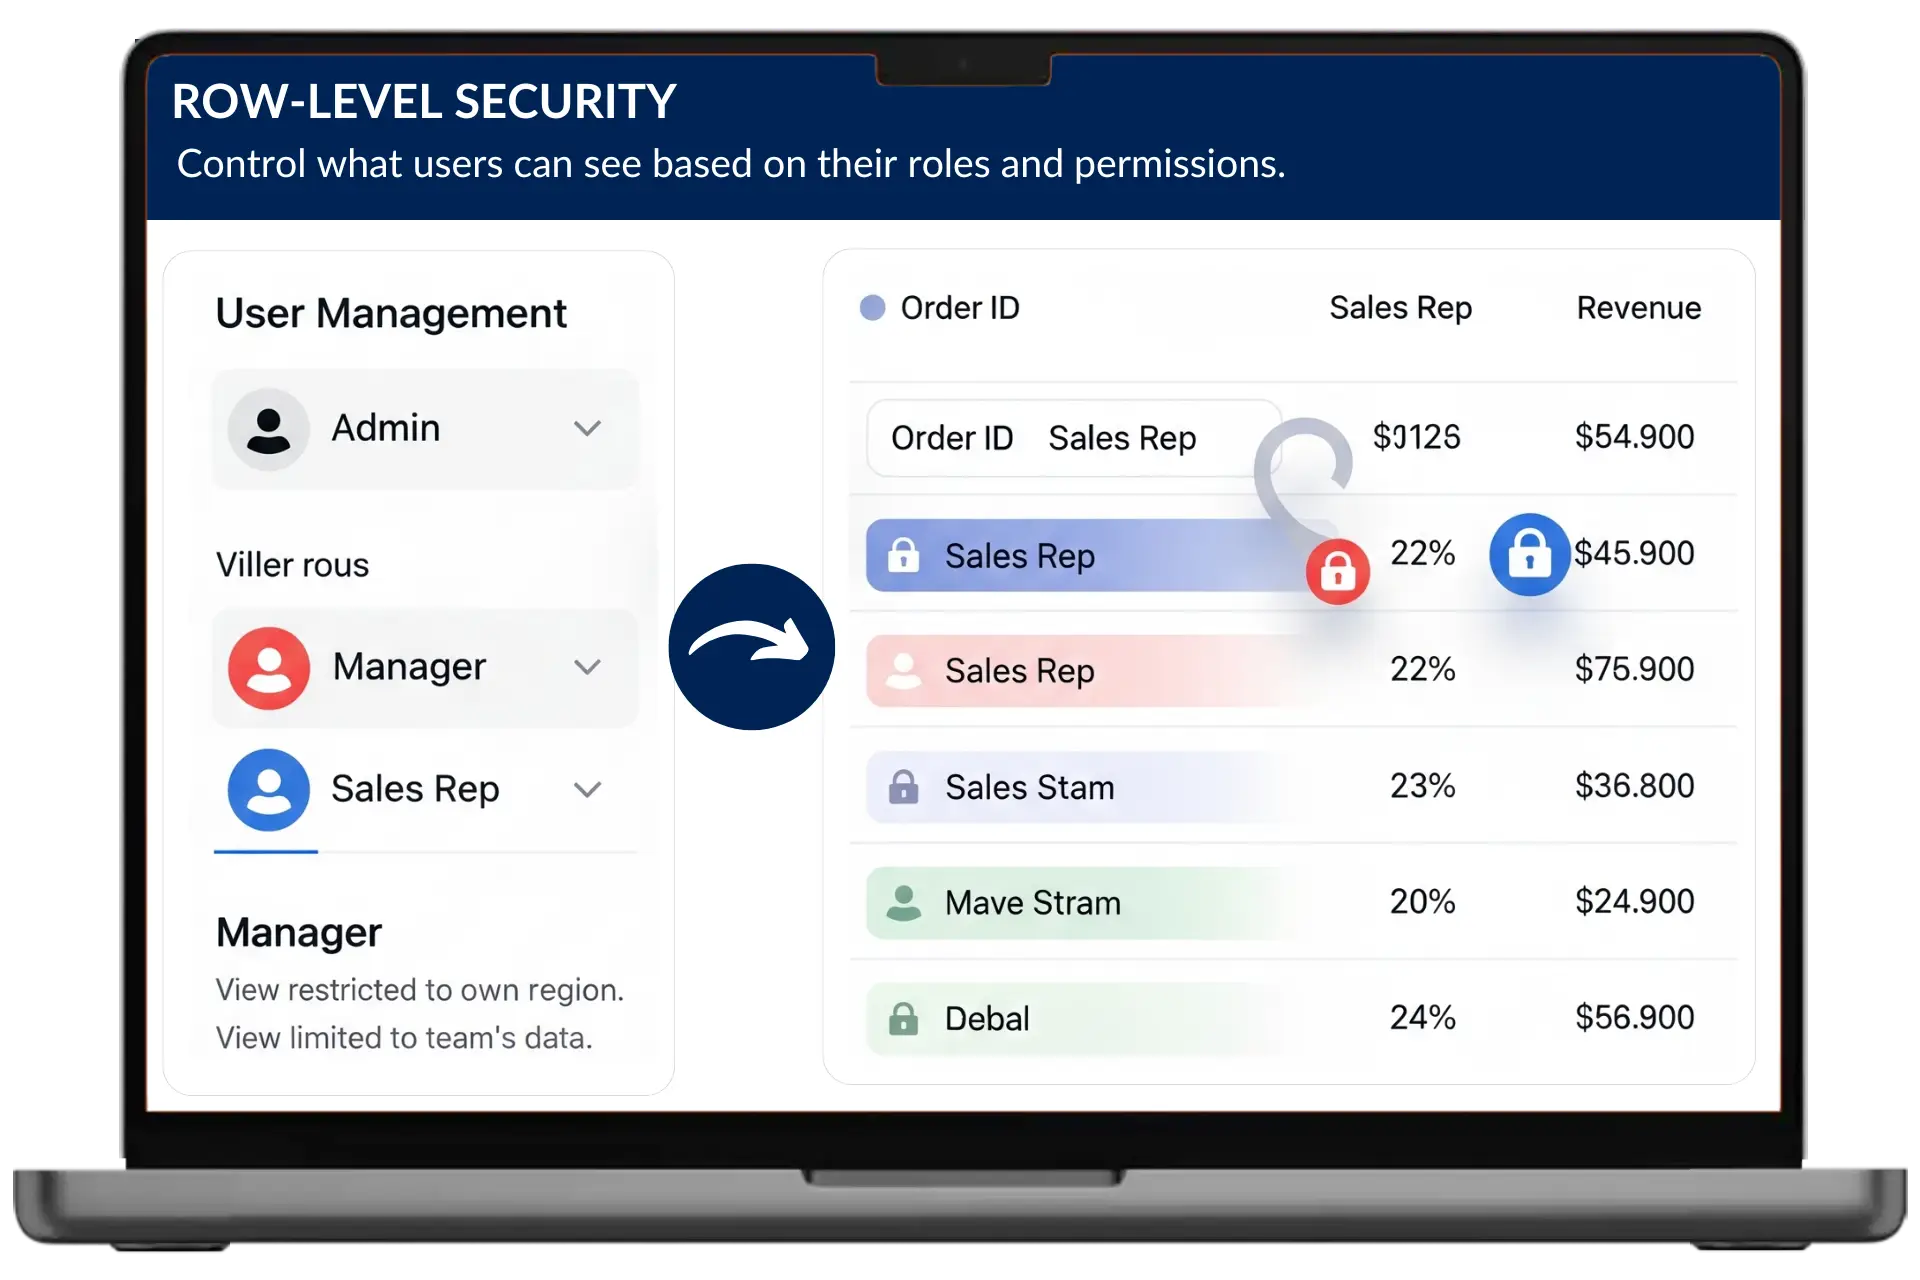
Yes, we implement strict row-level security to ensure users only access the data they are authorized to see.
We serve all major sectors as a leading data visualization agency, including construction, healthcare, fintech, logistics, education, and more.
We specialize in connecting and unifying data from diverse sources like spreadsheets, on-premise databases, and cloud platforms.
All solutions use enterprise-grade security protocols and role-based access controls.


Hi! Click on one of our team members below to chat on WhatsApp.
The team typically replies in a few minutes.