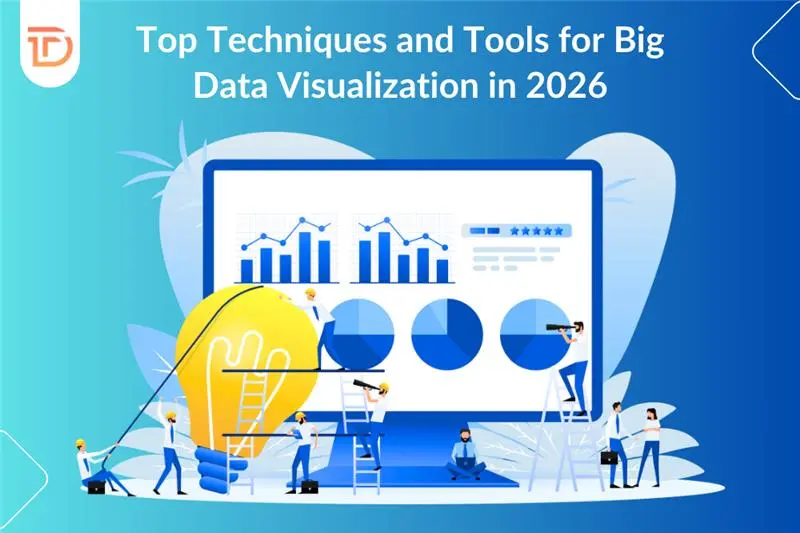
Data is growing faster than ever. Every business today collects information from websites, mobile apps, payment systems, customer interactions, cloud platforms, and even connected devices. From online purchases and customer feedback to operational reports and supply chain data, organizations are constantly generating valuable information that can influence important decisions. However, the problem is not collecting… Continue reading Top Techniques and Tools for Big Data Visualization in 2026
Top Techniques and Tools for Big Data Visualization in 2026
February 19, 2026


