

Leads KPI Power BI Dashboard
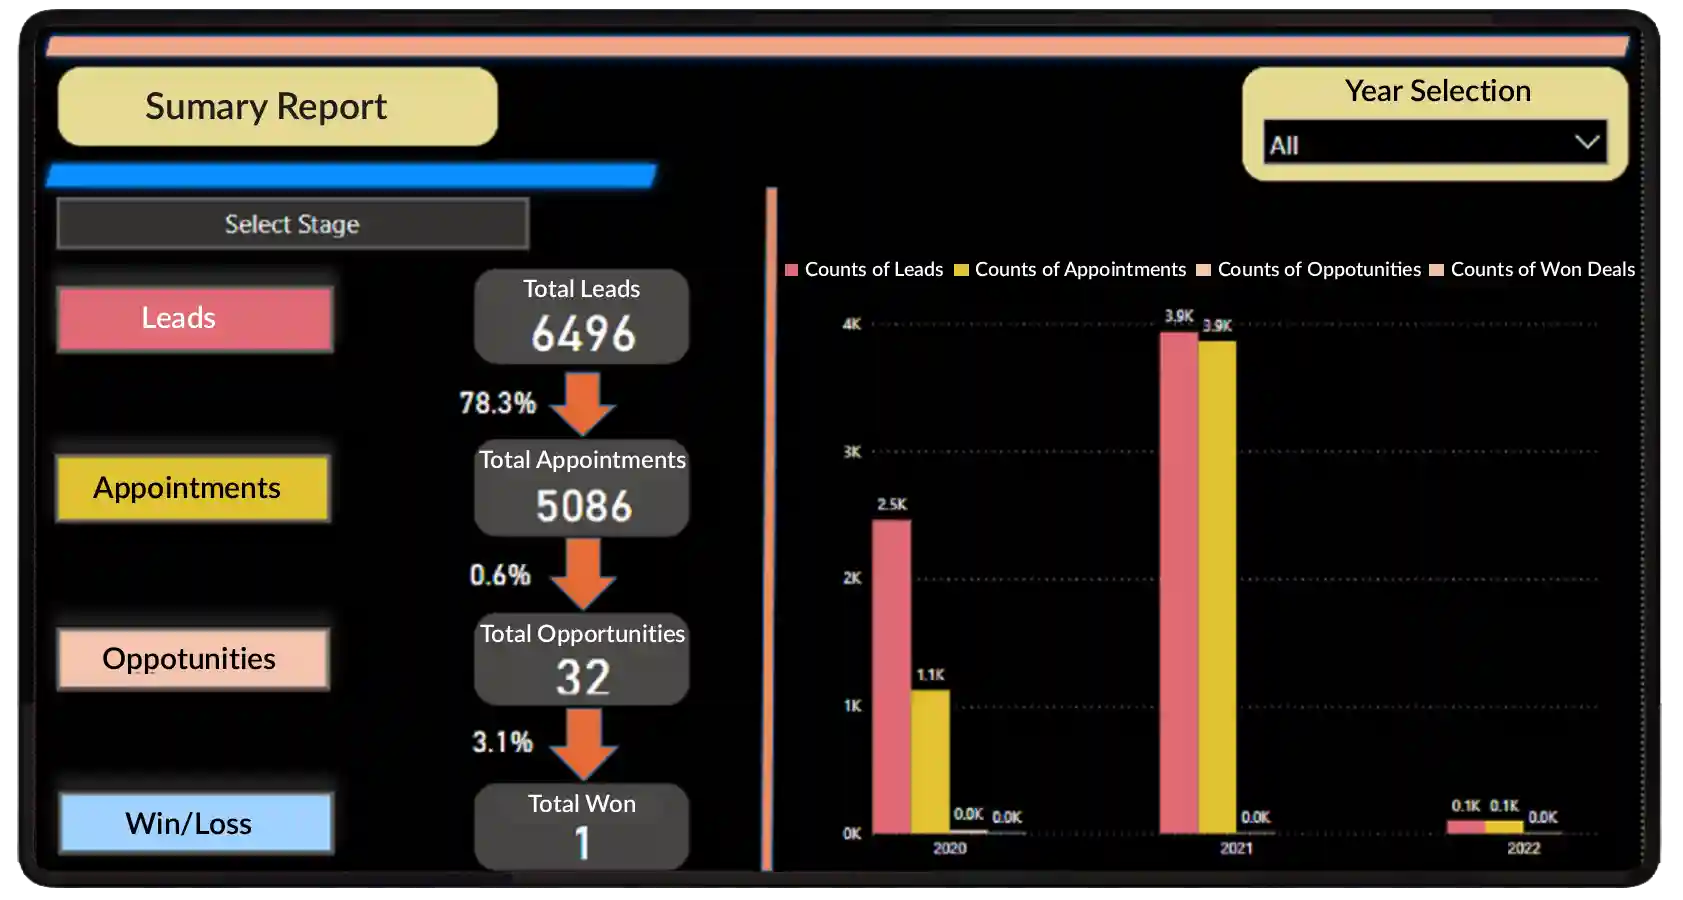
We created a leads KPI Power BI dashboard that helps the client track each step of their sales journey from the very first lead to the final deal closure. The goal was to give their sales and leadership teams real time visibility into performance, so they can focus on the highest value opportunities and improve conversions with confidence.
Client Requirements
The client wanted a single place where they could see how leads progress through the sales funnel. They were relying on scattered data which made it difficult to spot bottlenecks and evaluate growth. They needed clear insights to understand what is working and what requires improvement across leads appointments opportunities and won deals.
Visibility into all Funnel Stages
The dashboard had to present the entire journey in a clean and structured way that can be understood within seconds.
Meaningful Conversion Insights
They wanted automatic calculations that show the conversion percentage at every step so that the team can react quickly.
Segmentation for Better Targeting
Information needed to be grouped by factors like geography industry score category temperature and sourcing channel to support smarter decision making.
Geographical Performance Focus
They required a way to see which regions perform well and which regions require attention.
Reports Designed for Leadership
The visual presentation needed to be simple professional and effortless to explore during business review meetings.
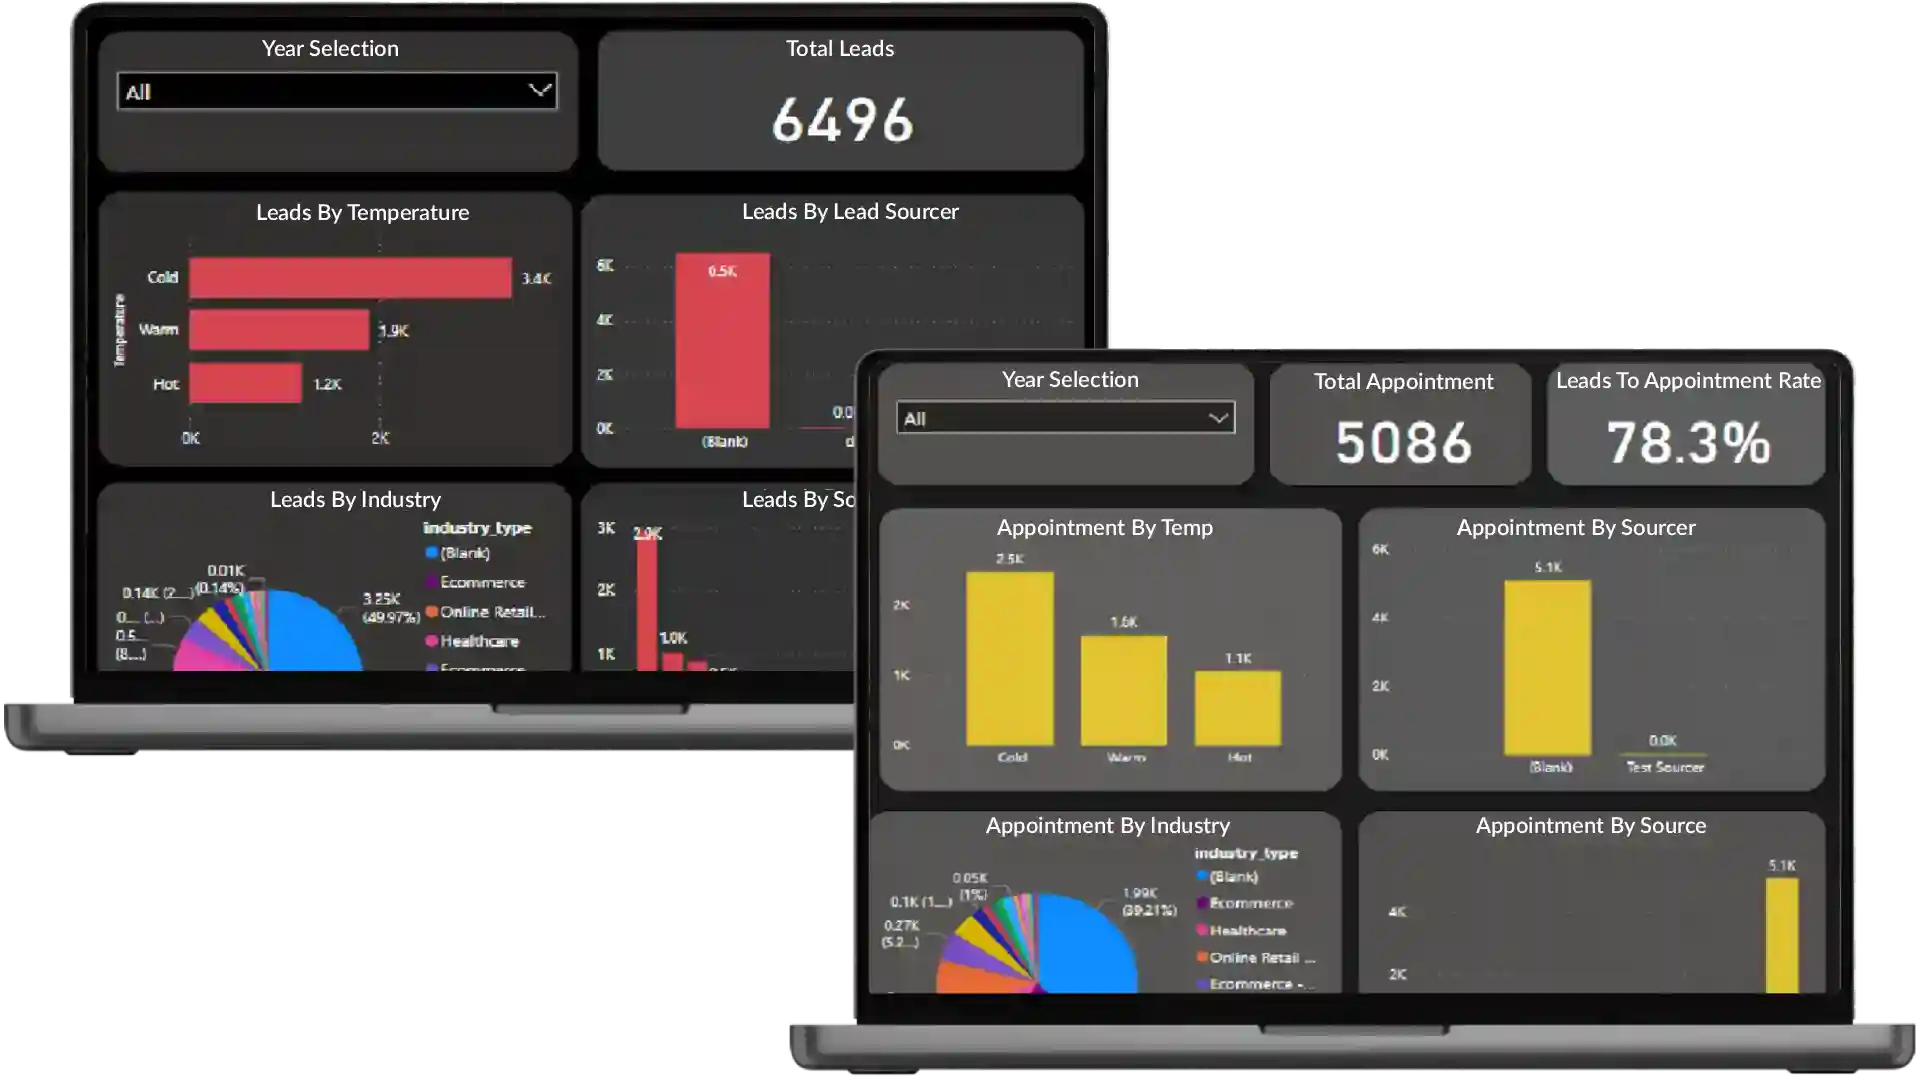
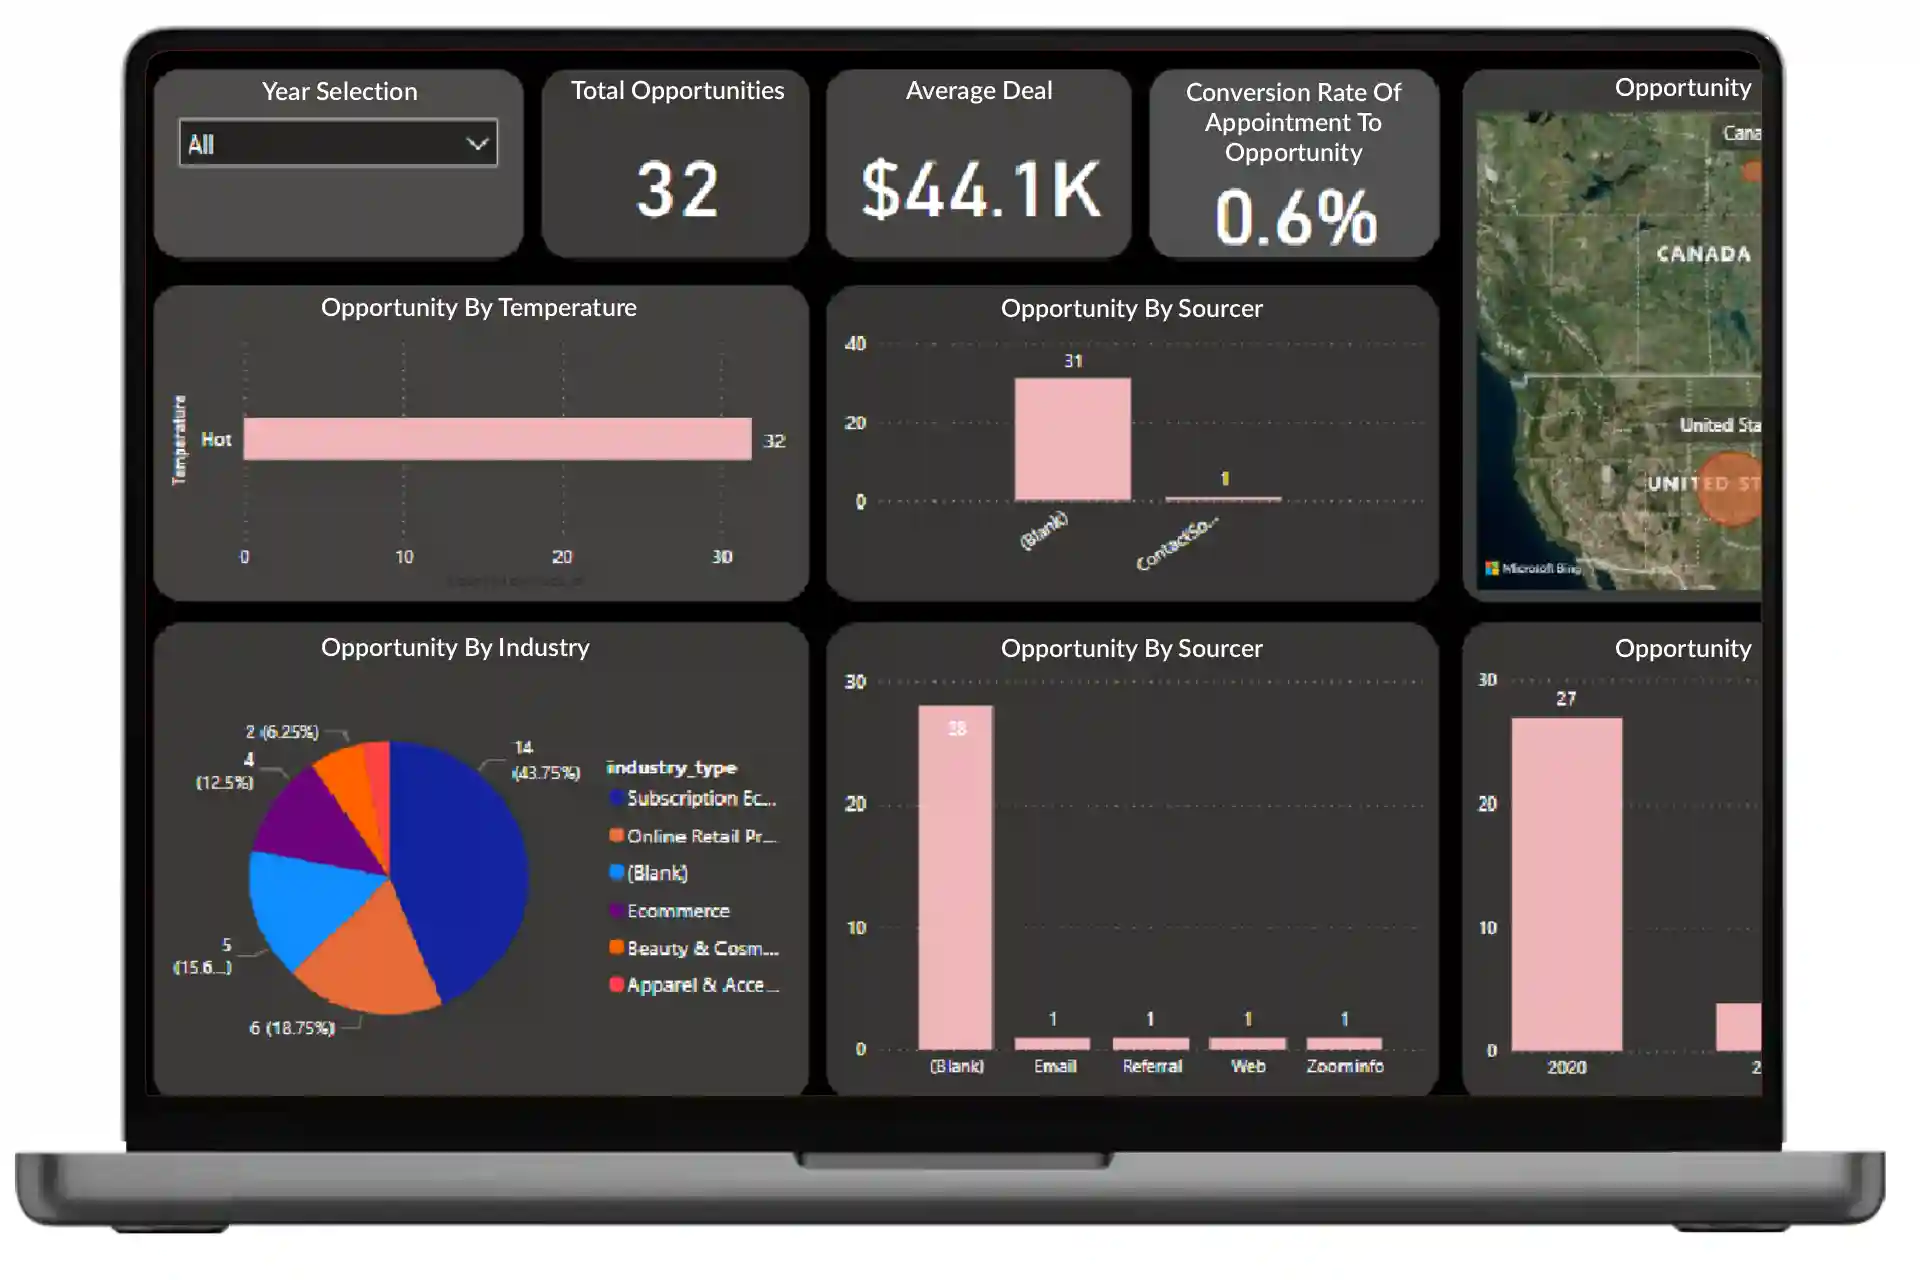
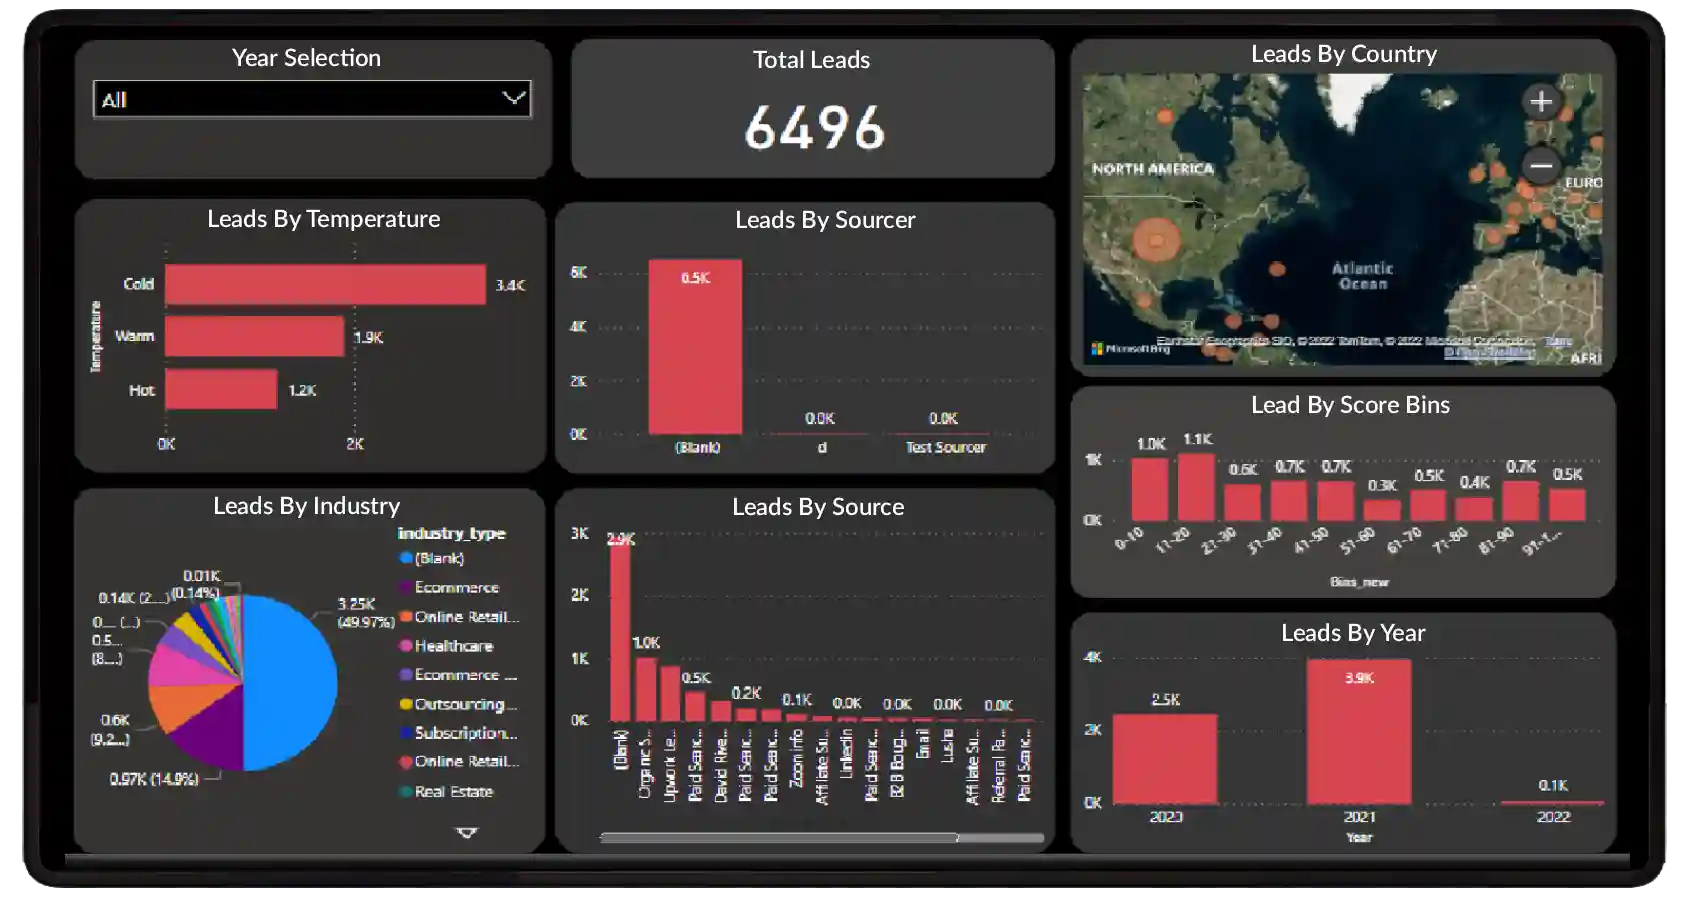
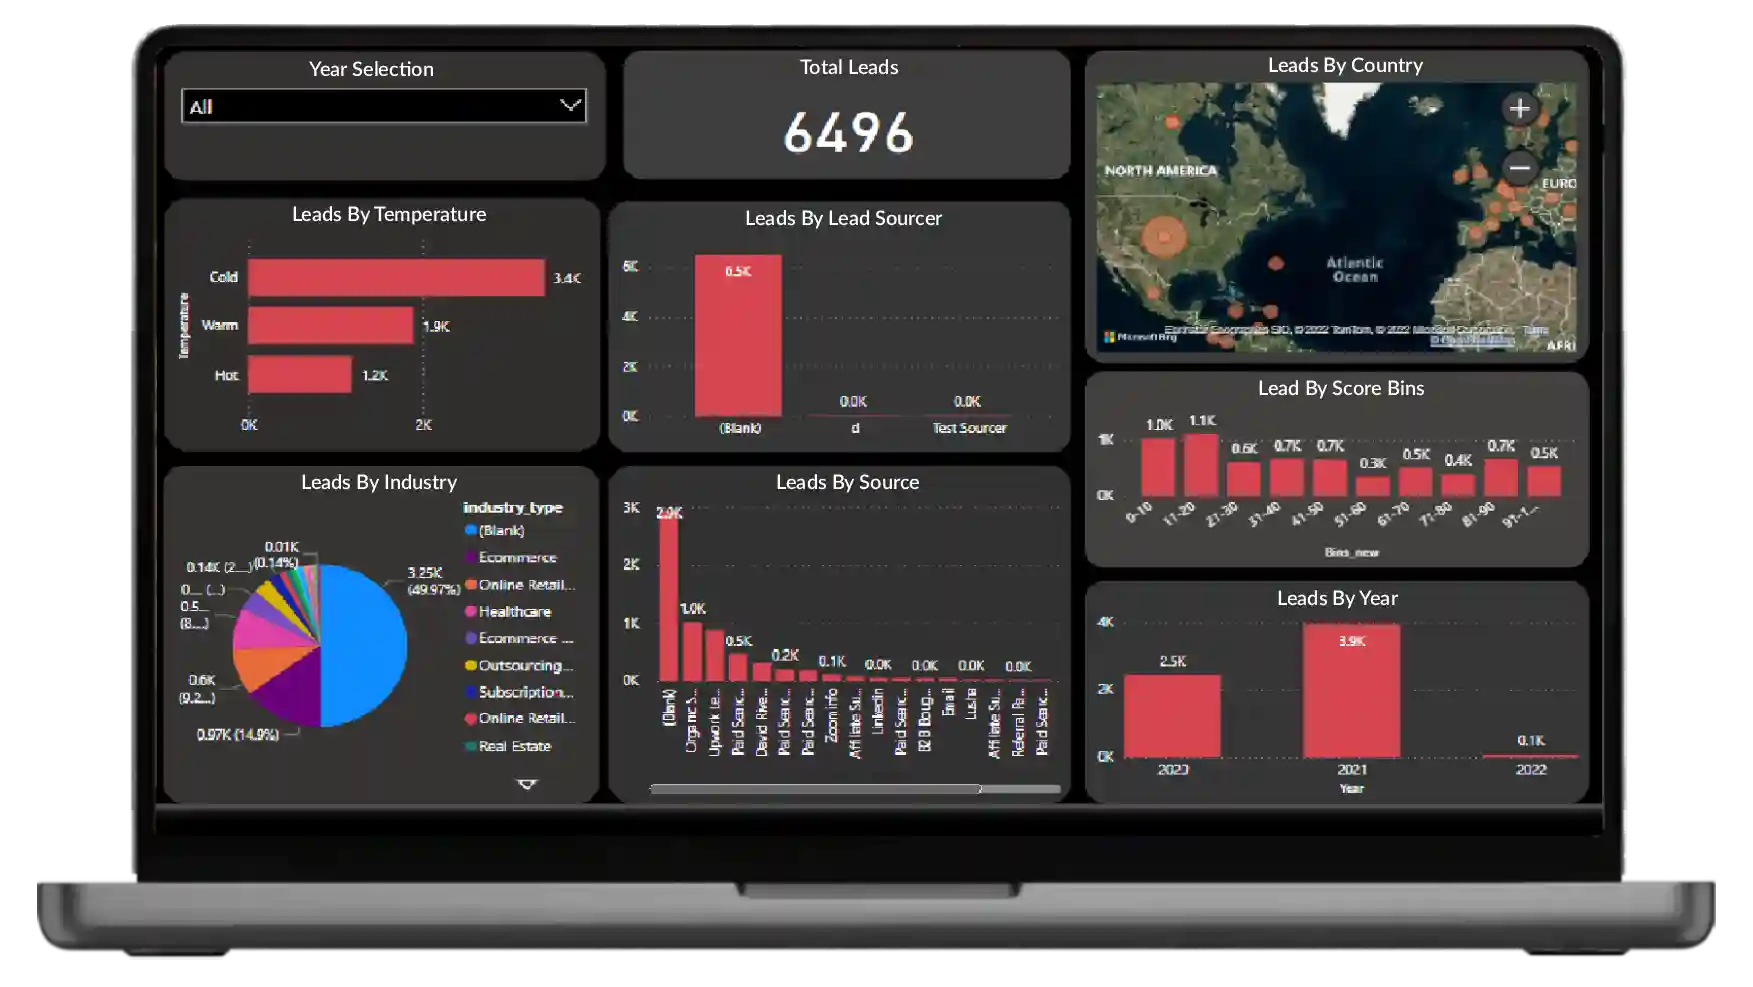
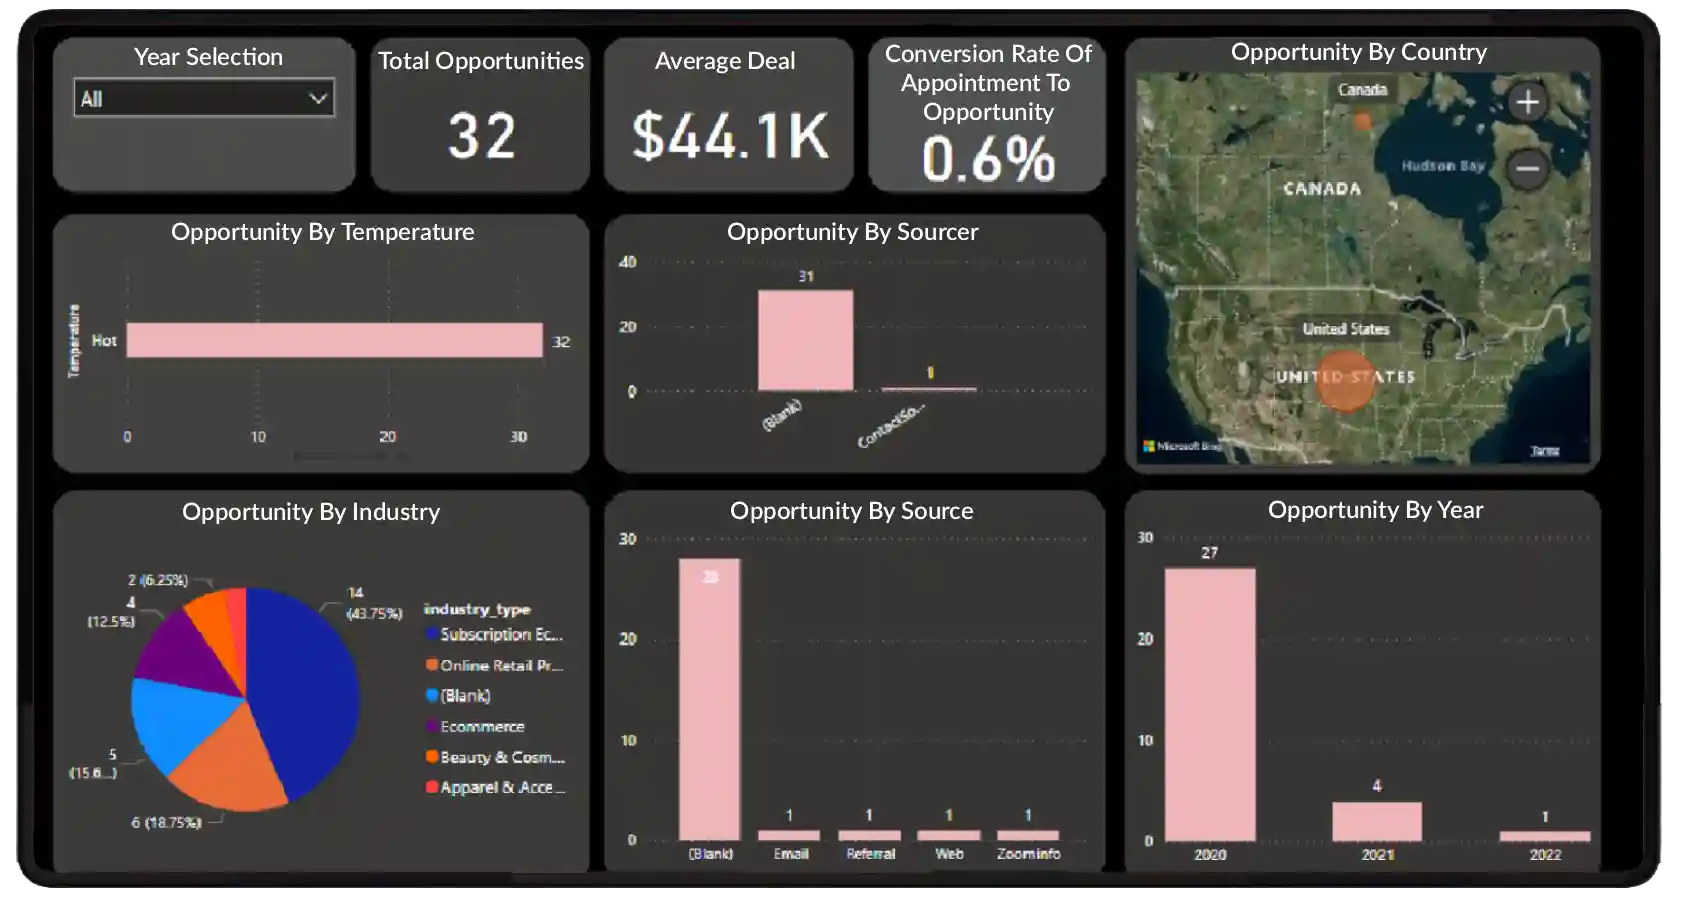
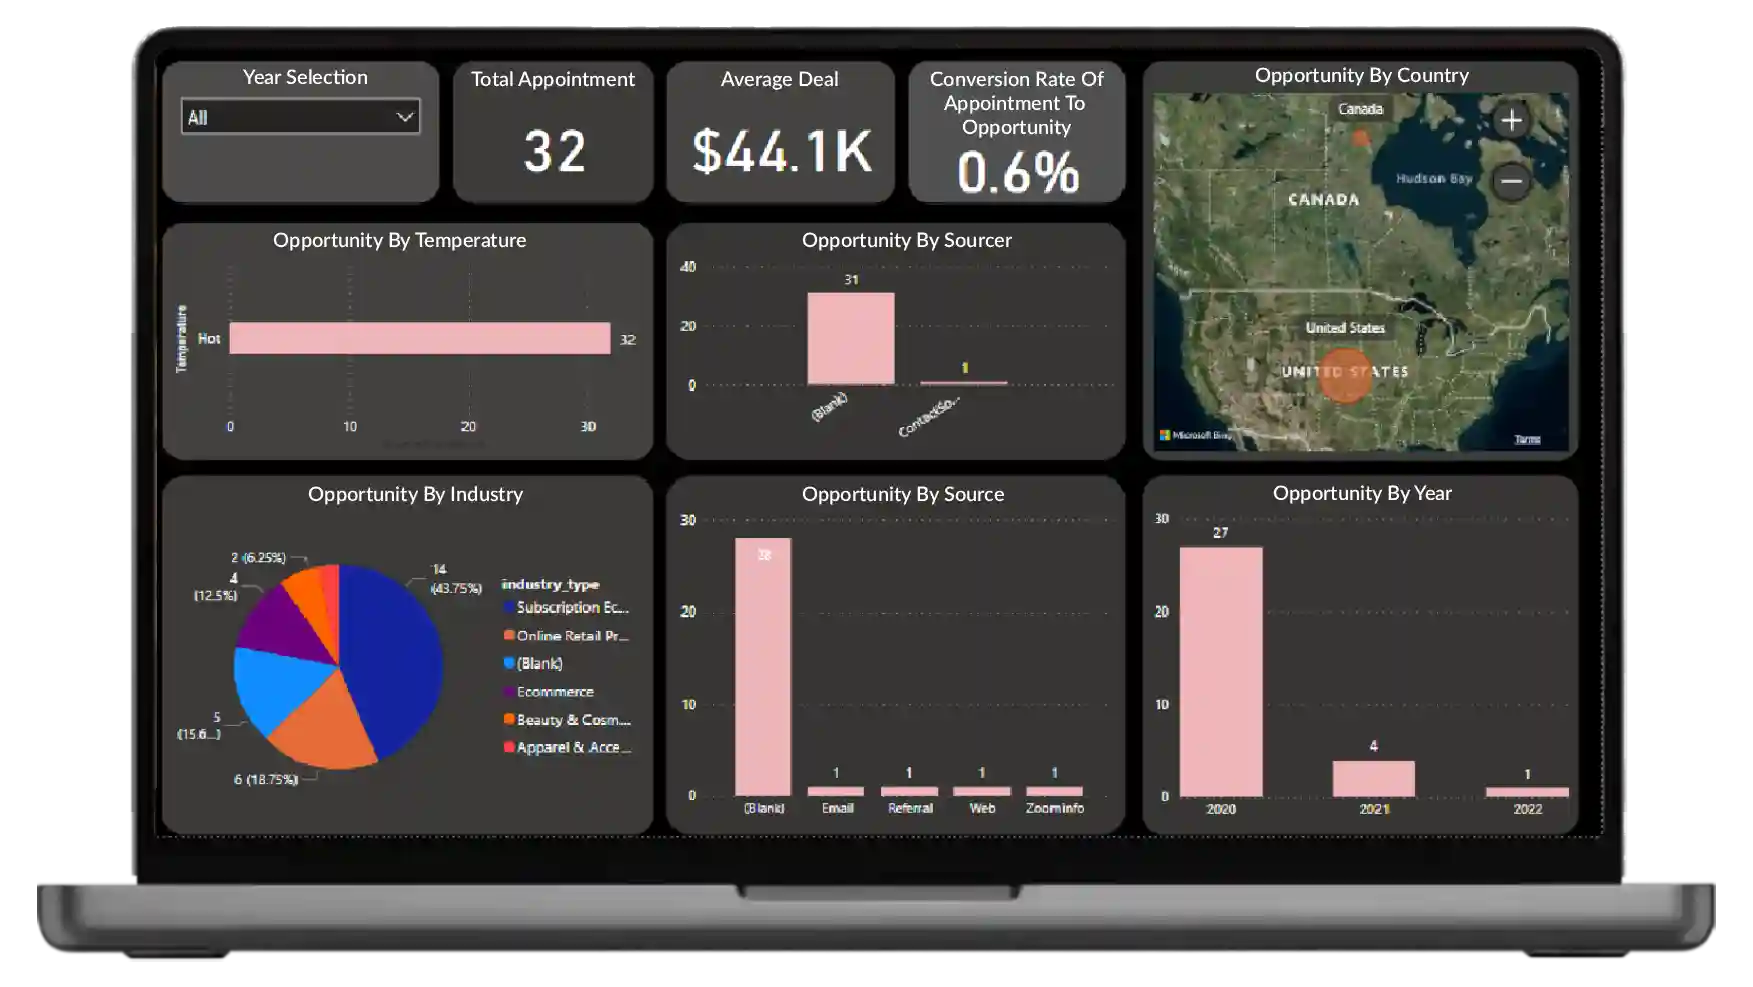
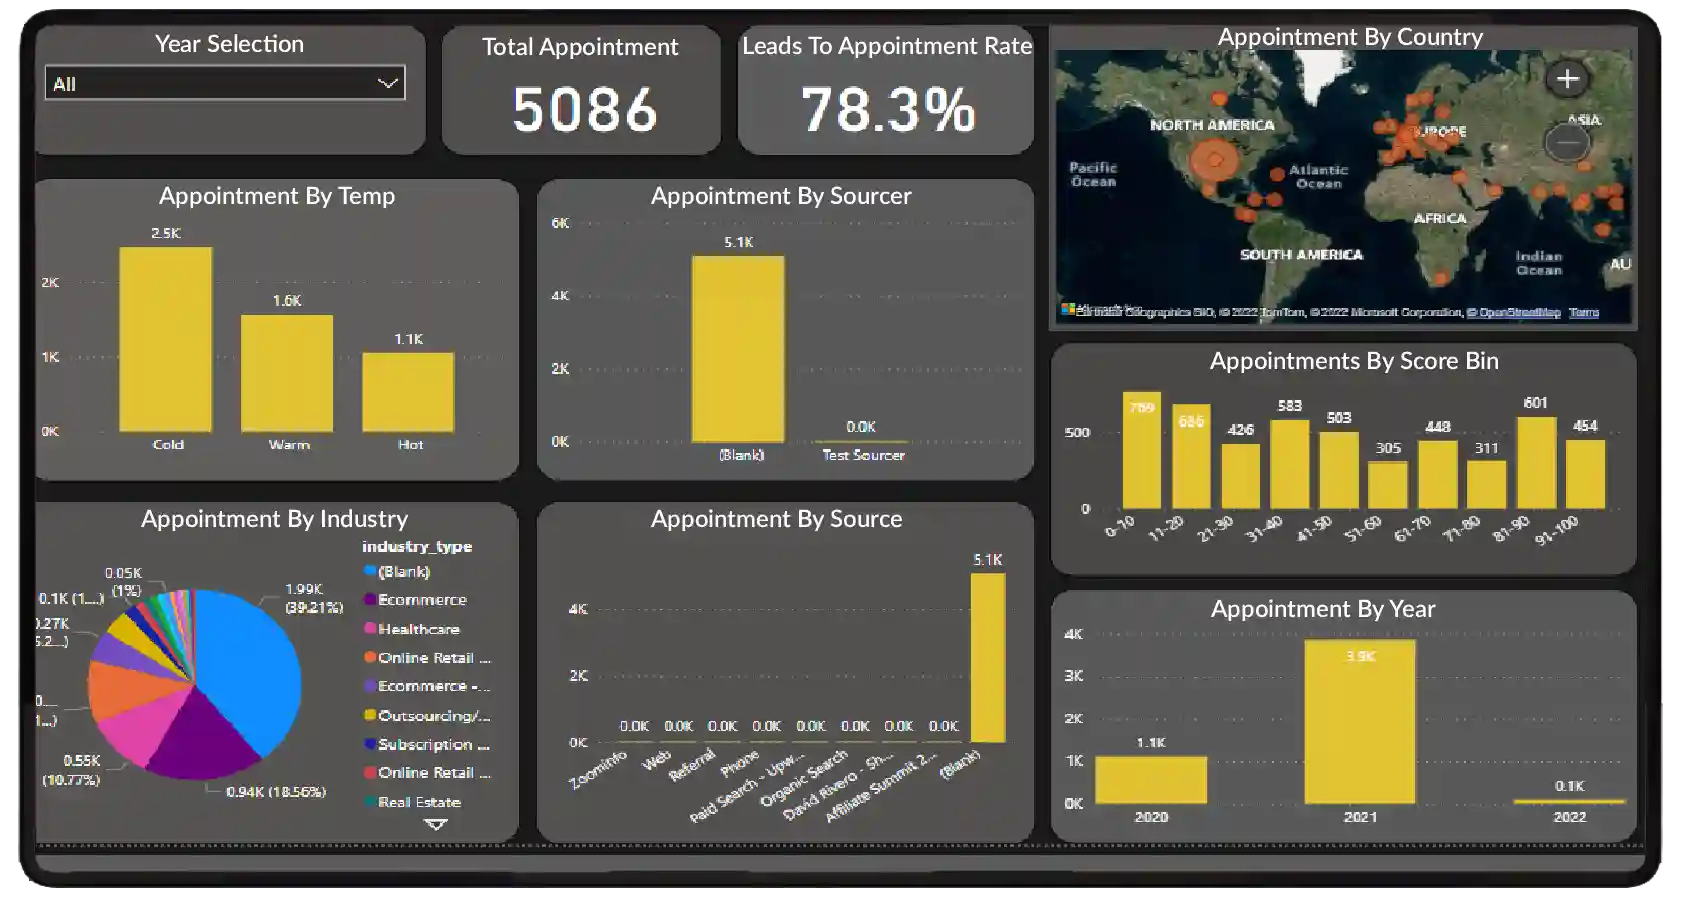
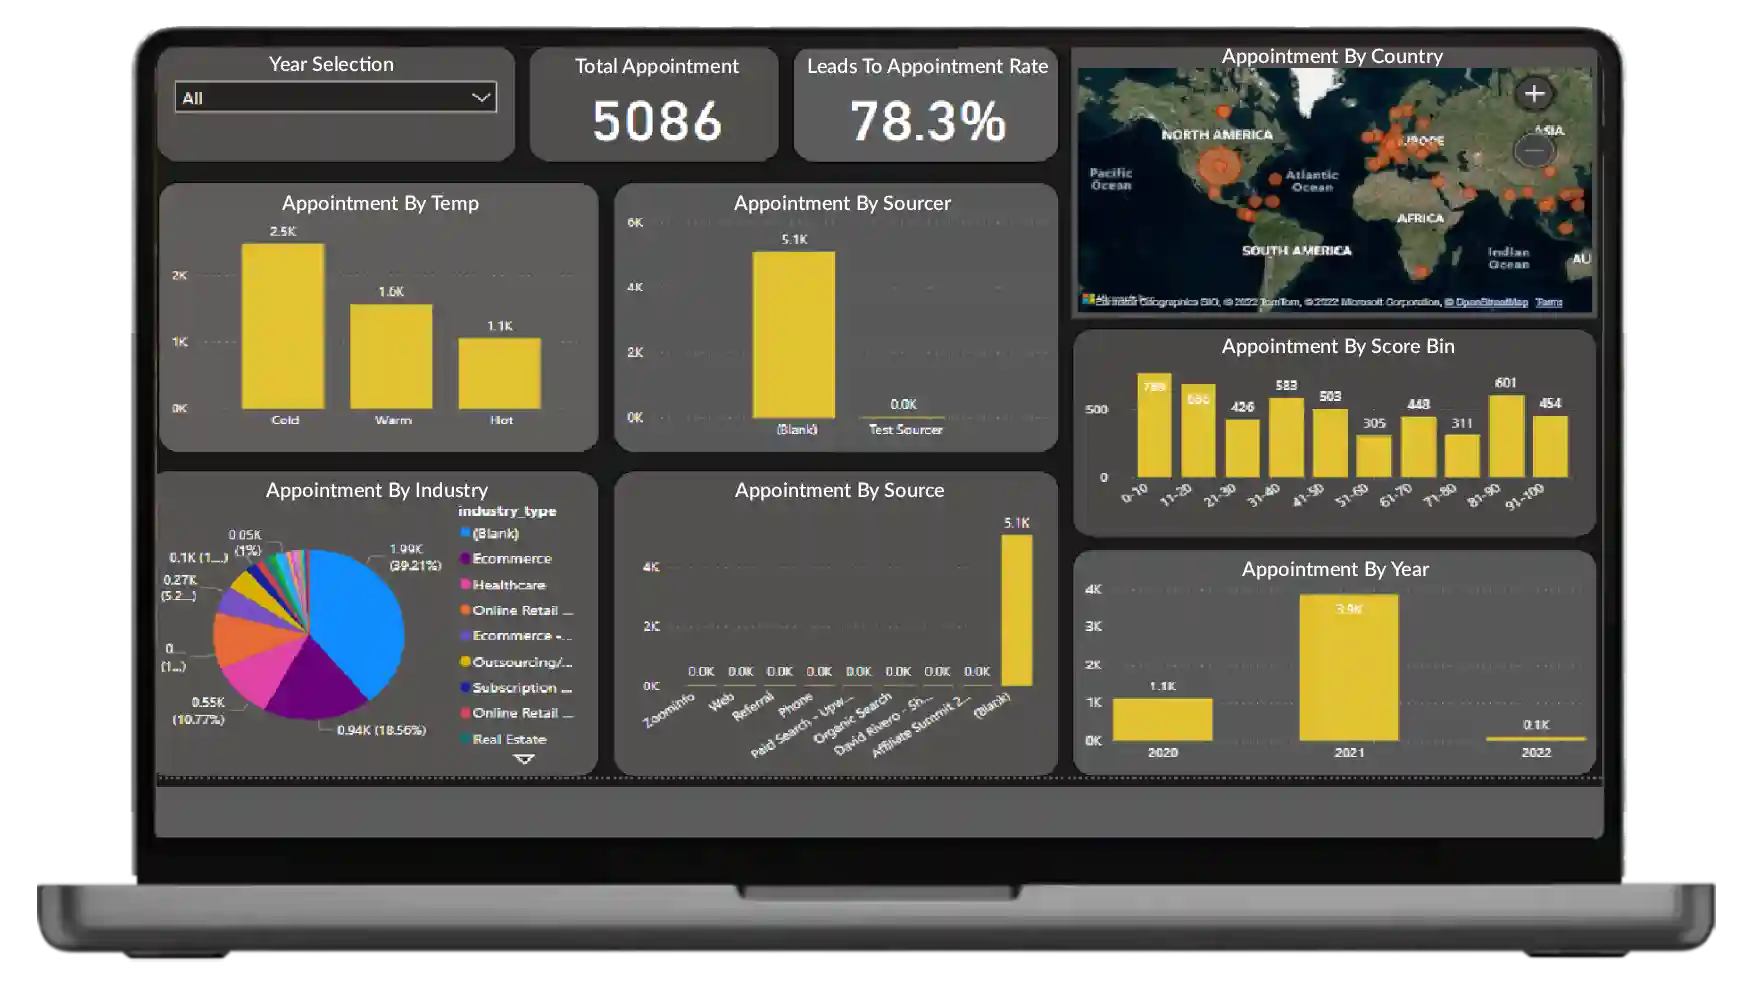
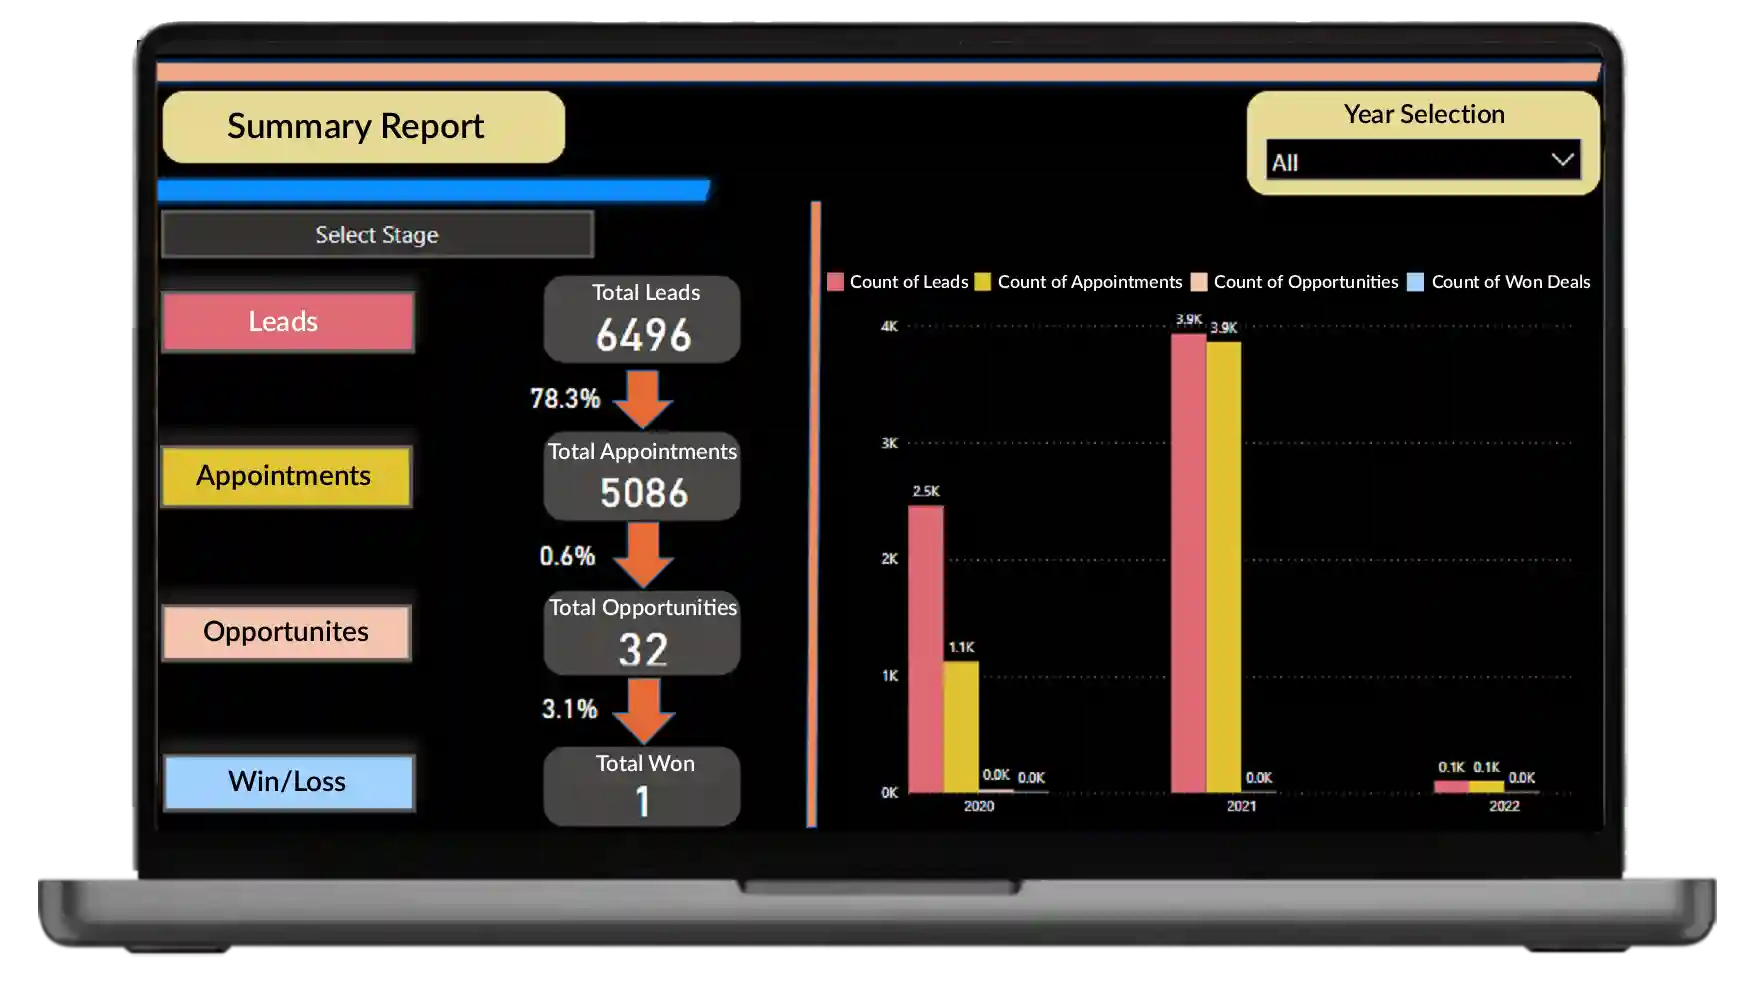
System Screenshots and Delivered Solution
Below are views from the actual reporting solution. Each dashboard provides valuable insights that can be used by sales and management teams to improve outcomes. Also Read>> How Much Do Company’s Charge for a Power BI Dashboard?
Technology Stack for Lead Tracking Dashboard
 Power Bi
- MYSQL
- Fresh Sales


Project Success and Impact
With real time analytics and a structured overview of every stage the sales team can now focus their efforts where it matters the most. This has already helped them make better and faster decisions including
- A deeper understanding of lead sources that convert well
- Better alignment between marketing and sales activities
- Quick identification of performance gaps
- More accurate revenue planning and opportunity prioritization
- Less manual reporting work for the operations team
The dashboard has become an everyday tool for leadership and sales teams and continues to support more informed data backed decisions across their organization.


