

Comprehensive Power BI Services for Smarter Business Insights
We offer end-to-end power bi dashboard development services that help you turn raw data into clear and meaningful insights. From planning and power bi dashboard design to implementation and ongoing support, dashboards are built to be easy to use, reliable, and aligned with your business needs so your team can make better decisions with confidence.

Dashboard & Report Development
Power BI dashboards and reports are designed to turn complex data into clear and easy-to-understand insights. This helps track performance, reduce manual effort, and highlight what is working and what needs attention.

Consulting & Strategy Services
A structured approach is used to define reporting goals and align them with business needs. This ensures the power bi dashboard supports better decision-making and delivers meaningful insights.

Data Integration & Modeling
Data from multiple sources is connected, cleaned, and organized into a structured format. This allows the power bi dashboard to present accurate, consistent, and reliable information across all reports.

Migration & Upgrade Services
Existing data from Excel or legacy systems is migrated to modern Power BI environments without disruption. This improves reporting efficiency and makes dashboards easier to manage as data grows.

Embedded & Application Analytics
Power BI dashboards are integrated into web or mobile applications to provide direct access to insights. This improves usability and allows users to view data within the tools they already use.

Optimization & Maintenance
Dashboard performance is improved by resolving speed and usability issues. Ongoing support ensures the power bi dashboard remains efficient, updated, and easy to use over time.
Power BI Analytics Driving Smarter Business Decisions
Your data already has answers, but it is not always easy to see them. We help you turn everyday data into clear insights using power bi dashboard solutions that are simple to use and easy to understand. Instead of spending time on manual reports, you get a complete view of your business performance in one place, so you can make faster and more confident decisions.

Power BI–Powered Analytics Technology Stack
We use a reliable and well-structured technology stack to build Power BI dashboards that are scalable, secure, and easy to manage. The right mix of tools ensures your data stays organized, accurate, and ready for analysis at all times.
Frontend

Backend
Libraries & Languages
Modules/Toolkits
Cloud & Data Sources
AI & Advanced Analytics
Security & Governance

Power BI Desktop
Power BI Mobile (iOS / Android)
Embedded Power BI (Web Apps / Portals)


Power BI Service
Azure Analysis Services
SQL Server / Azure SQL Database
Azure Synapse Analytics


DAX (Data Analysis Expressions)
Power Query (M Language)
SQL


Power Automate
Power Apps
On-Premises Data Gateway
REST APIs (Power BI APIs)


Azure Data Lake
SharePoint
Excel / CSV
Dynamics 365
SAP / Oracle / MySQL
Google Analytics


Power BI AI Visuals
Azure Cognitive Services
Natural Language Q&A
AutoML (Premium)


Row-Level Security (RLS)
Azure Active Directory
Workspace & Dataset Governance
Audit Logs & Usage Metrics


User-Focused Power BI Implementation Approach
We focus on end-user needs to deliver Power BI solutions that are simple to use, easy to understand, and ready to support better decisions from day one.

Insight Discovery Workshops
User needs, reporting gaps, and key decision points are identified to understand what insights are required. This helps ensure the Power BI dashboard delivers meaningful and relevant information.

Data Refresh & Automation Setup
Automated data refresh schedules are configured to keep reports up to date. This ensures consistent data flow and allows users to access the latest insights without manual effort.

Performance Optimization & Load Handling
Reports are optimized to improve speed and handle larger data volumes efficiently. This helps maintain smooth performance and ensures dashboards load quickly across different users.

User Enablement
Clear guidance is provided to help users understand dashboards and interpret data confidently. This improves usability and ensures insights are used effectively in daily decisions.

Monitoring Usage
Dashboard usage and engagement are tracked to understand how reports are being used. This helps improve relevance, usability, and overall adoption over time.
Empowering Industry-Specific Insights with Power BI
We help organizations across industries make better use of their data with Power BI dashboards. Clear and structured insights make it easier to track performance, understand trends, and support faster and more confident decisions based on real data.


Benefits of Power BI Dashboard for Your Organization
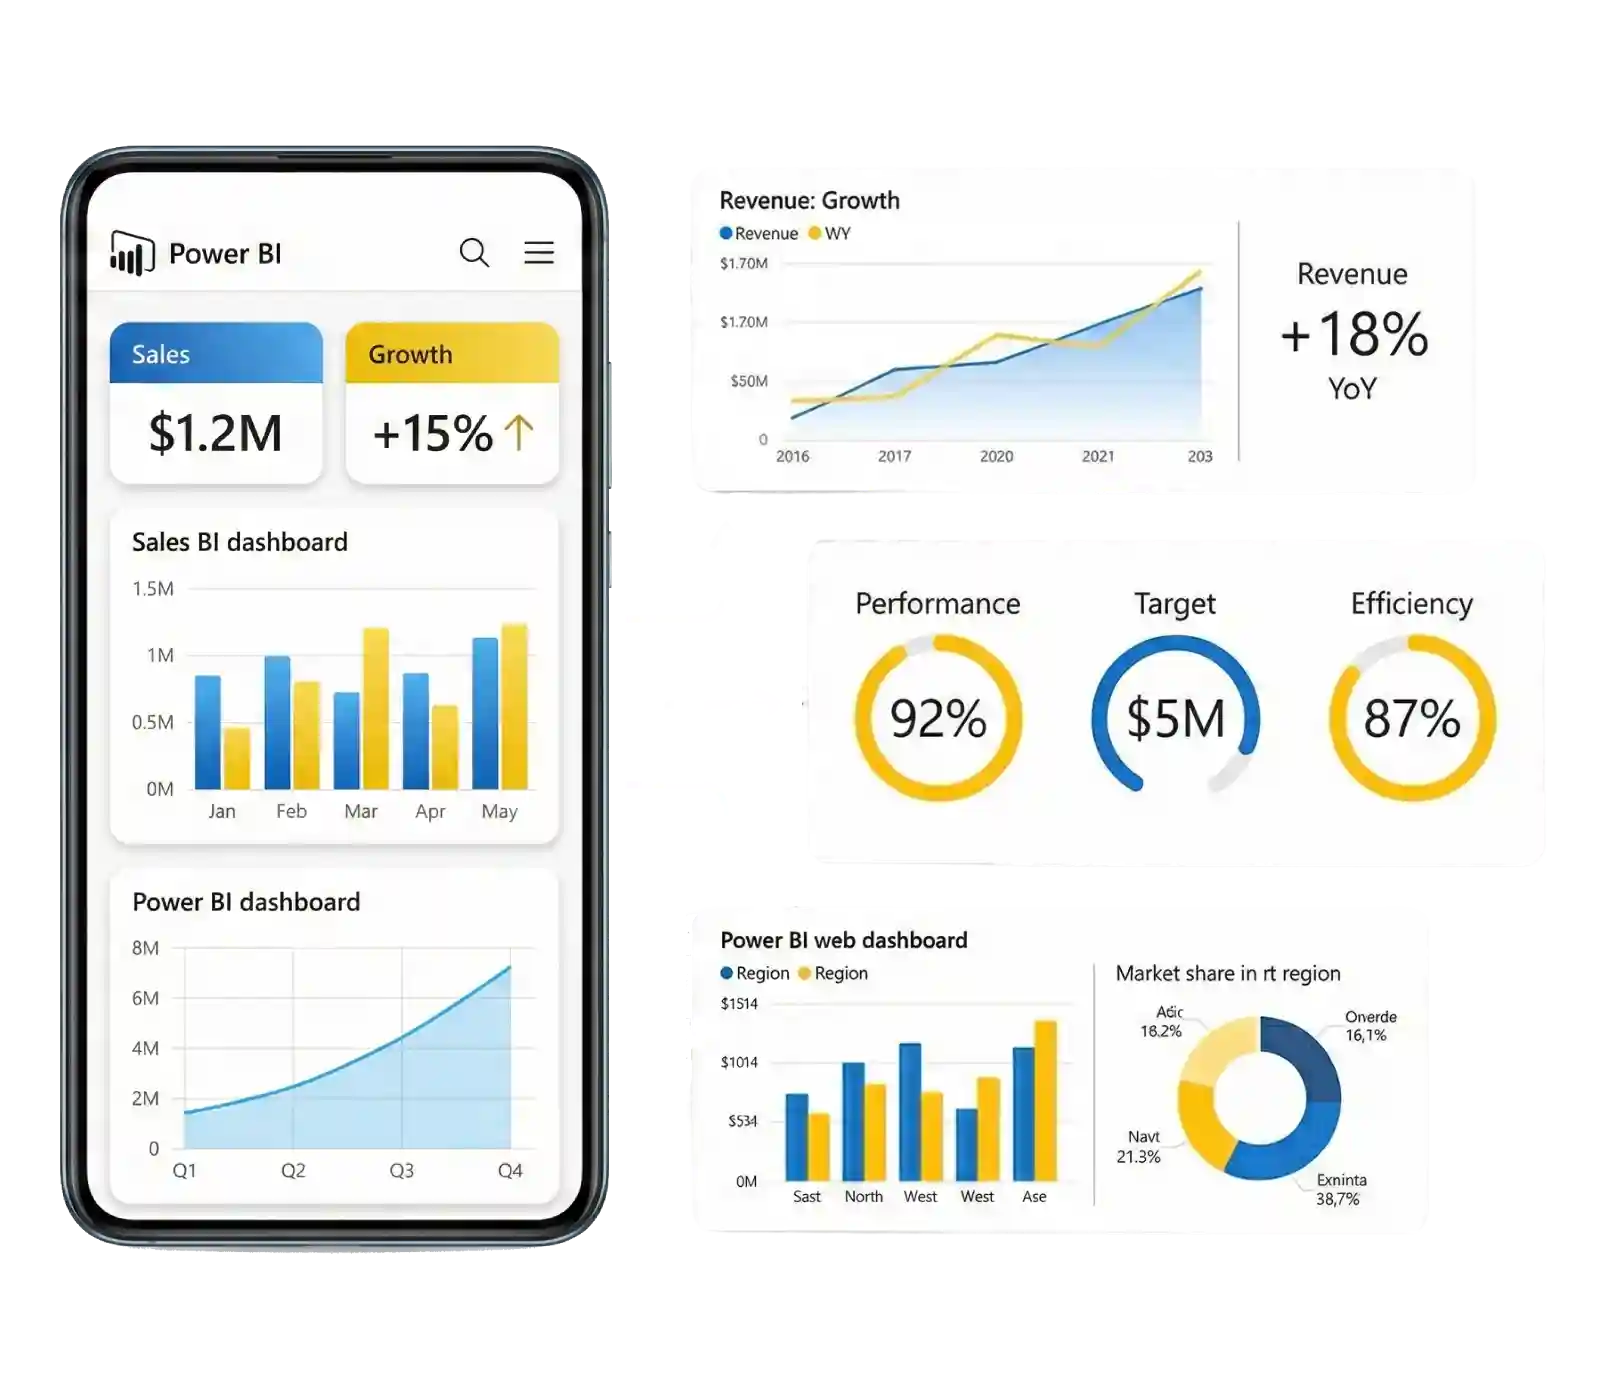
We help organizations use Power BI to turn data into clear and actionable insights. With interactive dashboards and real-time reporting, it becomes easier to track performance, understand trends, and support better decisions across teams as business needs grow.
Live Performance Tracking
Power BI dashboards allow continuous tracking of key metrics in one place. This helps identify changes quickly, monitor performance in real time, and respond faster to important business trends.
Team-Based Insight Sharing
Dashboards can be shared across teams using tools like Excel, Teams, and SharePoint. This makes it easier to collaborate, review data together, and use insights within existing workflows.
Centralized Data Availability
All business data is brought together into a single and structured platform. This reduces data silos, improves accessibility, and ensures consistent and accurate insights are available whenever needed.
Power BI Analytics Dashboard – Project Overview
We build custom Power BI dashboards that turn raw data into clear and interactive insights. Each dashboard is designed to support analysis, improve decision-making, and make it easier to track business performance through simple and user-friendly visuals.
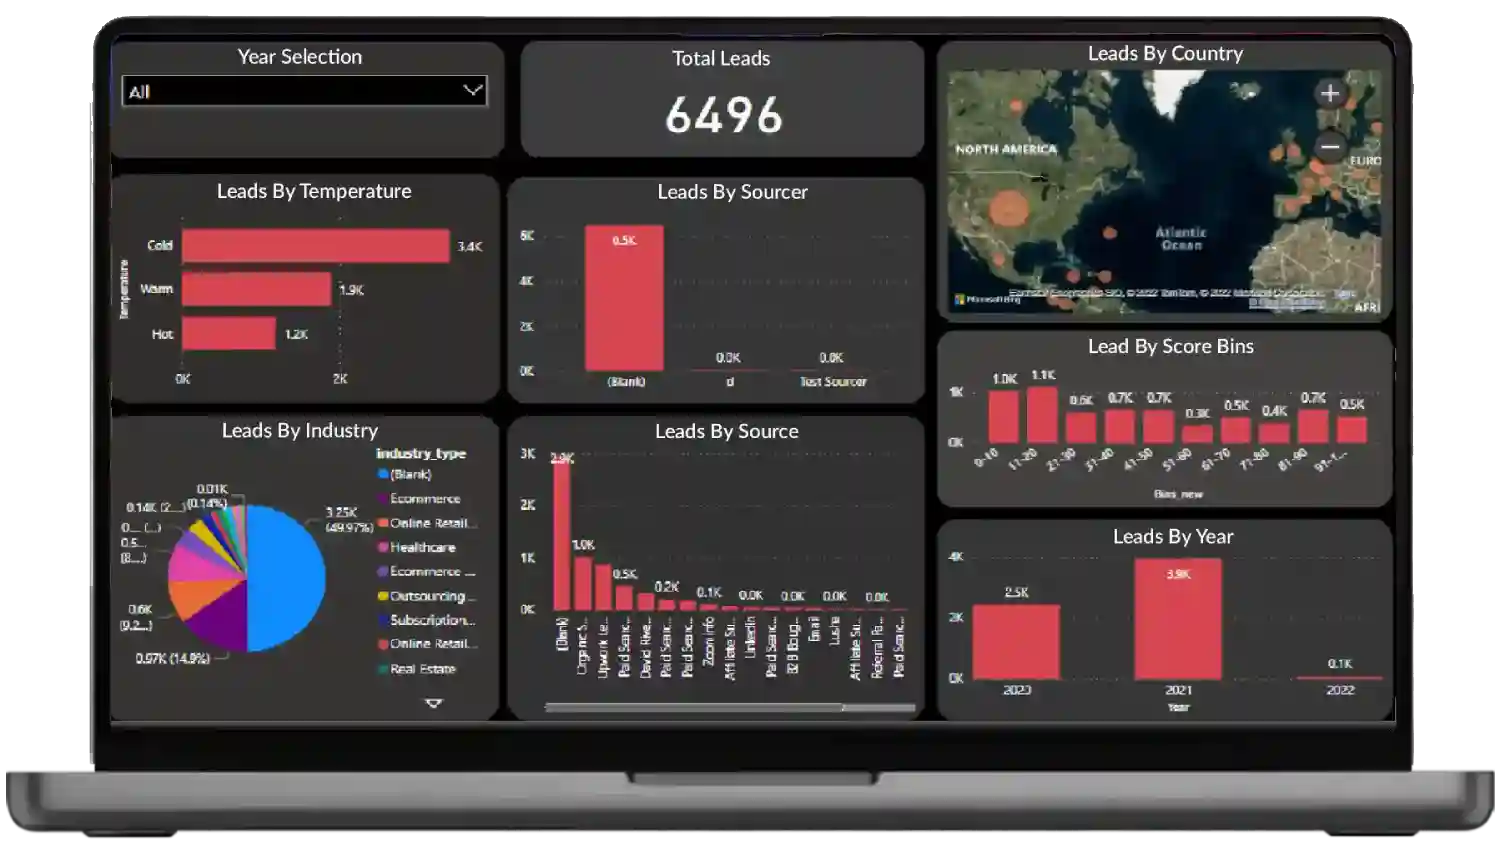
Leads KPI Power BI Dashboard
This dashboard helps sales and marketing teams monitor lead quality, track performance across different sources, and understand regional trends over time. Clear visuals make it easier to identify patterns, compare results, and focus on areas that need improvement. Insights from the dashboard support better planning, stronger conversion strategies, and more effective pipeline management.
Connecting Business Systems with Power BI Solutions
We help bring data from different business systems into one unified Power BI environment. This makes it easier to maintain consistent reporting, get real-time visibility, and use insights to support better decisions and improve overall efficiency.
SQL Data Sources & Databases
Automation & Workflow Systems
Excel-Based Reporting & Spreadsheets
Enterprise ERP Platforms
Customer Relationship (CRM) Solutions
Human Resource Management (HRMS)
IoT Device Management Platforms
SQL Data Sources & Databases
Structured databases are connected to manage large datasets, generate reports, and track performance metrics efficiently within a single dashboard.

Automation & Workflow Systems
Data from workflow and automation tools is integrated to track processes, monitor performance, and improve overall operational efficiency.

Excel-Based Reporting & Spreadsheets
Excel data is transformed into structured dashboards, making it easier to move from manual reporting to more dynamic and interactive insights.

Enterprise ERP Platforms
ERP systems are connected to provide a clear view of business operations, helping track performance across departments in one place.

Customer Relationship (CRM) Solutions
Customer data is integrated to track interactions, sales performance, and engagement, helping improve decision-making and customer management.

Human Resource Management (HRMS)
HR data is structured into dashboards to track employee performance, attendance, and workforce trends in a clear and organized way.

IoT Device Management Platforms
Visualize device data and operational signals to monitor performance and support proactive maintenance.
Why Choose Us for Power BI Consulting
We help businesses get the most value from Power BI by building solutions that are clear, scalable, and secure. The focus stays on usability, performance, and real business impact so Power BI becomes a practical tool for everyday decision-making.
01
Business-Focused Insights
Dashboards are designed to answer real business questions and present data in a way that supports faster and more confident decision-making.
02
Advanced Data Modeling
Optimized data models and DAX calculations ensure accurate reporting, better performance, and smooth handling of complex datasets.
03
Secure Analytics Setup
Role-based access and data governance practices protect sensitive information while ensuring the right users have access to the right data.
04
Scalable BI Solutions
Solutions are built to handle growing data, users, and reporting needs without affecting performance or usability over time.
05
Microsoft Ecosystem Ready
Seamless integration with tools like Excel, Azure, Teams, and SharePoint ensures a smooth and connected reporting experience.
06
User Adoption Support
Guidance and support help users understand dashboards, making it easier to adopt Power BI and use insights effectively in daily work.
End-to-End Power BI Consulting & Analytics Services
We provide complete Power BI consulting and analytics services that help turn data into clear and actionable insights. From data integration and dashboard development to advanced analytics and ongoing support, each solution is designed to improve visibility, support better decisions, and grow with your business over time.
Frequently Asked Questions About Power BI

What is Power BI and how does it help businesses?
Power BI is a business intelligence tool that helps organizations analyze data, create interactive dashboards, and make data-driven decisions.
Which data sources can Power BI connect to?
Power BI connects with SQL databases, Excel files, cloud platforms, ERP, CRM, HRMS, APIs, and many other business systems.
Can Power BI handle real-time data reporting?
Yes, Power BI supports real-time and near real-time dashboards, enabling businesses to monitor live data and performance metrics.
Is Power BI suitable for small and mid-sized businesses?
Absolutely. Power BI is cost-effective, scalable, and suitable for startups, SMBs, and large enterprises alike.
How secure is Power BI for business data?
Power BI offers enterprise-grade security with role-based access, data encryption, and compliance with Microsoft security standards.
Can Power BI dashboards be shared across teams?
Yes, dashboards and reports can be securely shared with teams, departments, or external users based on access permissions.
Do you provide Power BI customization and support services?
Yes, we offer customized Power BI dashboards, integrations, performance optimization, and ongoing support and maintenance.
How Much Do Company’s Charge for a Power BI Dashboard?
A Power BI dashboard developer charges $30 to $100 per hour, requiring 100 hours to develop, with a total cost between $3000 and $10000.


