BI and Data Visualization
Data is growing faster than ever. Every business today collects information from websites, mobile apps, payment systems, customer interactions, cloud platforms, and even connected devices. From online purchases and customer feedback to operational reports and supply chain data, organizations are constantly generating valuable information that can influence important decisions. However, the problem is not collecting […]
Data is emerging as a powerful tool that is shaping how businesses make decisions, understand their customer base and market trends, and craft their strategies. But data alone isn’t useful until it’s analyzed! This is where data analytics comes into the picture. Data analytics is the process through which an organization turns raw numbers into […]
Marketing today is driven by data, with campaigns producing a constant stream of information from multiple channels such as social media, email, and search engines. While this data holds the key to understanding audience behavior and campaign effectiveness, its sheer volume and complexity often make it difficult to interpret. Raw numbers and spreadsheets can overwhelm […]
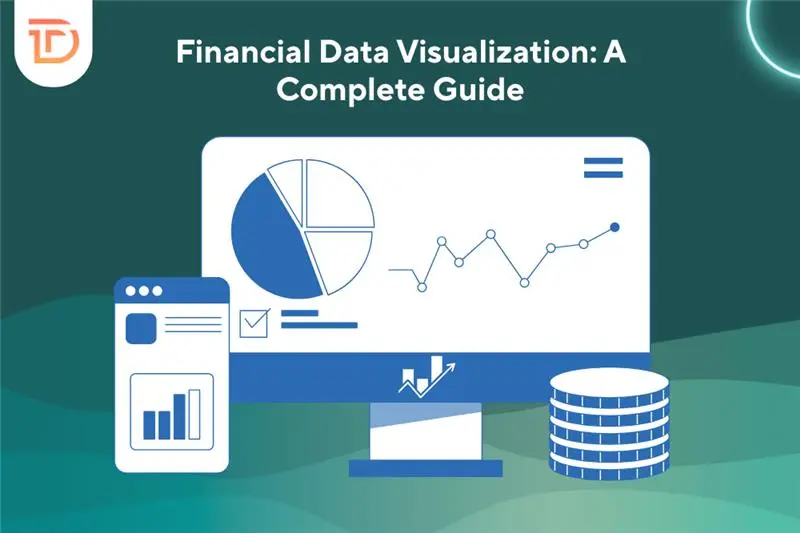
Financial information often feels dry and overwhelming when presented as raw numbers or spreadsheets. A clever visual design transforms complexity into clarity, turning data into compelling narratives. Readers find patterns, trends, and anomalies emerge naturally when numbers wear visuals instead of lists. through charts and graphs helps beginners and professionals spot opportunities and risks. Visual […]
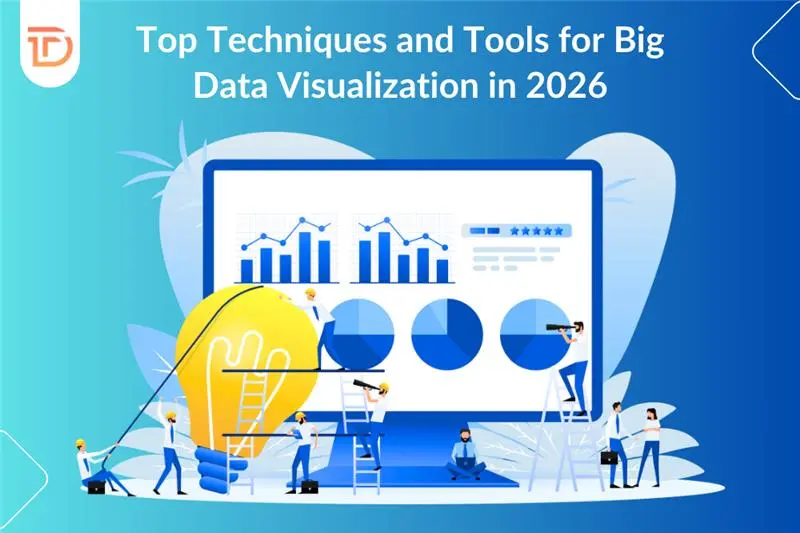
Modern enterprises handle enormous volumes of data daily, ranging from customer behavior to internal workflows. Every action contributes to an expanding pool of information that, without proper tools, can quickly become overwhelming. Transforming that data into clear, visual formats helps businesses uncover insights that drive smarter decisions. Visualization tools simplify complex data sets, making it […]
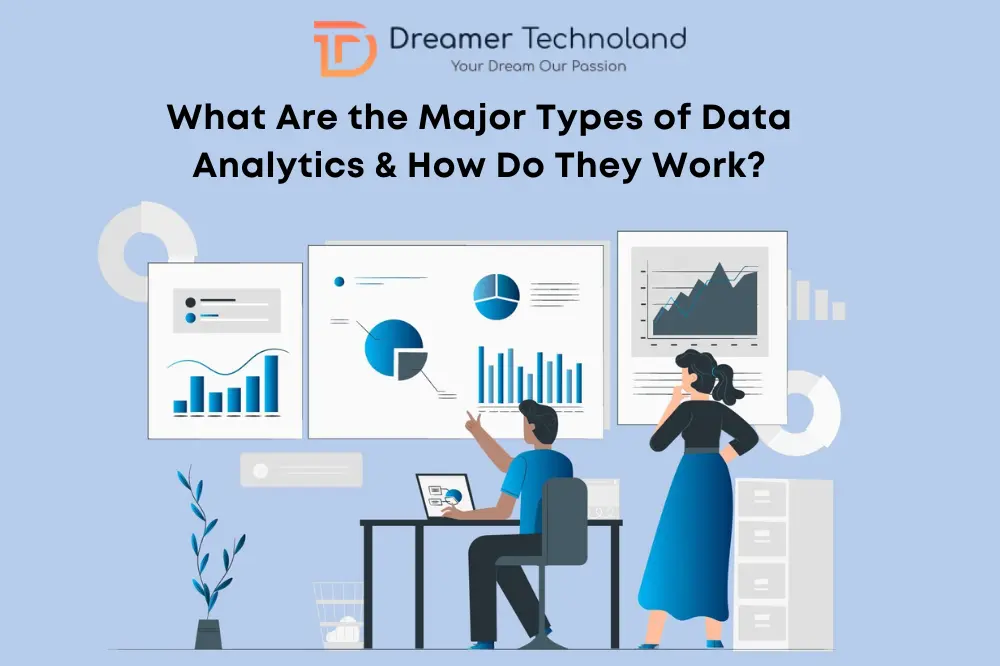
Data has become the driving force behind how modern businesses operate, grow, and adapt in an ever-evolving marketplace. As organizations generate increasing volumes of data from operations, customer behavior, digital platforms, and various internal systems, there lies an untapped potential to use this data to make strategic decisions. This is where data analytics becomes a […]
In today’s data-driven world, businesses are packed with vast amounts of information. To harness this data effectively, two terms often come up: business analytics and business intelligence. While they may seem interchangeable, they serve different purposes and have unique methodologies. Let’s delve into these differences and explore how they can benefit your organization. Stride along […]
Data visualization is a buzzword that has become immensely popular in the past few years due to its ability to help businesses make data-driven decisions. Data visualization tool is popularly used for drawing reasonable conclusions, creating information-rich presentations, and sharing discoveries from massive data sets that could help businesses and companies propel towards growth. The […]
In a recent report by Research and Markets, it was revealed that the retail analytics market is expected to grow at an 18% rate between 2019 and 2025. The market valuation is expected to surge by 9.5 billion in the coming years. The flabbergasting number reveals the potential retail analytics market has. Data is like […]
Power BI is one of the most prominent tools in the business analytics ecosystems, enabling companies to sort through piles of data, analyze them, and turn them into actionable forms that are easy to understand. Another reason for the popularity of this business intelligence is that it is owned by a well-respected tech giant— Microsoft. […]