



A regional bank processes millions of transactions every month. Its risk team sits on years of customer behavioral data. Its lending division has default rate patterns going back a decade. And yet, when the board asks for a consolidated view of exposure across product lines, three analysts spend four days pulling data from six different systems, cleaning it manually in spreadsheets, and producing a report that is already partially outdated by the time it reaches the table.
This is not an unusual scenario. It is the daily operational reality for a significant number of financial institutions, and it represents a fundamental mismatch between the data that organizations hold and their ability to extract timely, actionable intelligence from it. Business intelligence in banking and finance is the technology and practice that closes that gap.
The financial services sector has recognized this urgency clearly. According to The Business Research Company, the global BFSI business intelligence market was valued at USD 24.03 billion in 2025 and is projected to reach USD 26.97 billion in 2026, growing at a compound annual growth rate of 12.2%. By 2030, that figure is expected to climb to USD 42.35 billion, driven by rising adoption of AI-powered decision intelligence, real-time fraud analytics, and the expanding need for personalized financial insights at scale.
Whether you are a CTO at a commercial bank, a CFO evaluating analytics infrastructure, or a product leader building financial services software, this guide covers what BI in financial services actually does, why it matters, where it delivers the most measurable value, and what to consider when selecting or building your own BI solution.
What Business Intelligence Actually Means in a Financial Services Context
Business intelligence is not a single tool or software platform. It is a combination of technologies, processes, and practices that help organizations collect data from multiple sources, transform it into structured formats, and surface it as visual reports, dashboards, and analytical insights that decision-makers can act on confidently and quickly.
In a financial services context, the data sources feeding into a BI system are both numerous and complex. Core banking systems, CRM platforms, trading systems, payment processors, loan origination software, compliance databases, and market data feeds all generate information that individually tells part of a story. Business intelligence in banking and finance connects those streams into a unified picture that executives, analysts, risk managers, and relationship managers can each use according to their specific role and responsibility.
The distinction that matters most in practice is between reporting and intelligence. Traditional reporting tells you what happened yesterday. Well-implemented BI in financial services tells you what is happening right now, helps you understand why it is happening, and increasingly gives you tools to anticipate what is likely to happen next. That shift from backward-looking reports to real-time and predictive intelligence is where the competitive value in modern financial analytics solutions is concentrated.
Financial services analytics is not about having more data. Most institutions already have more data than they can process. It is about having the right tools to make that data legible, reliable, and actionable for the people who need to make consequential decisions quickly.
The Real Benefits of BI in Financial Services: What Changes When It Works Properly
The benefits of BI in financial services are most clearly understood not in abstract terms but through the specific operational problems it solves and the capabilities it unlocks. The following covers the areas where well-implemented financial services business intelligence creates the most measurable difference.
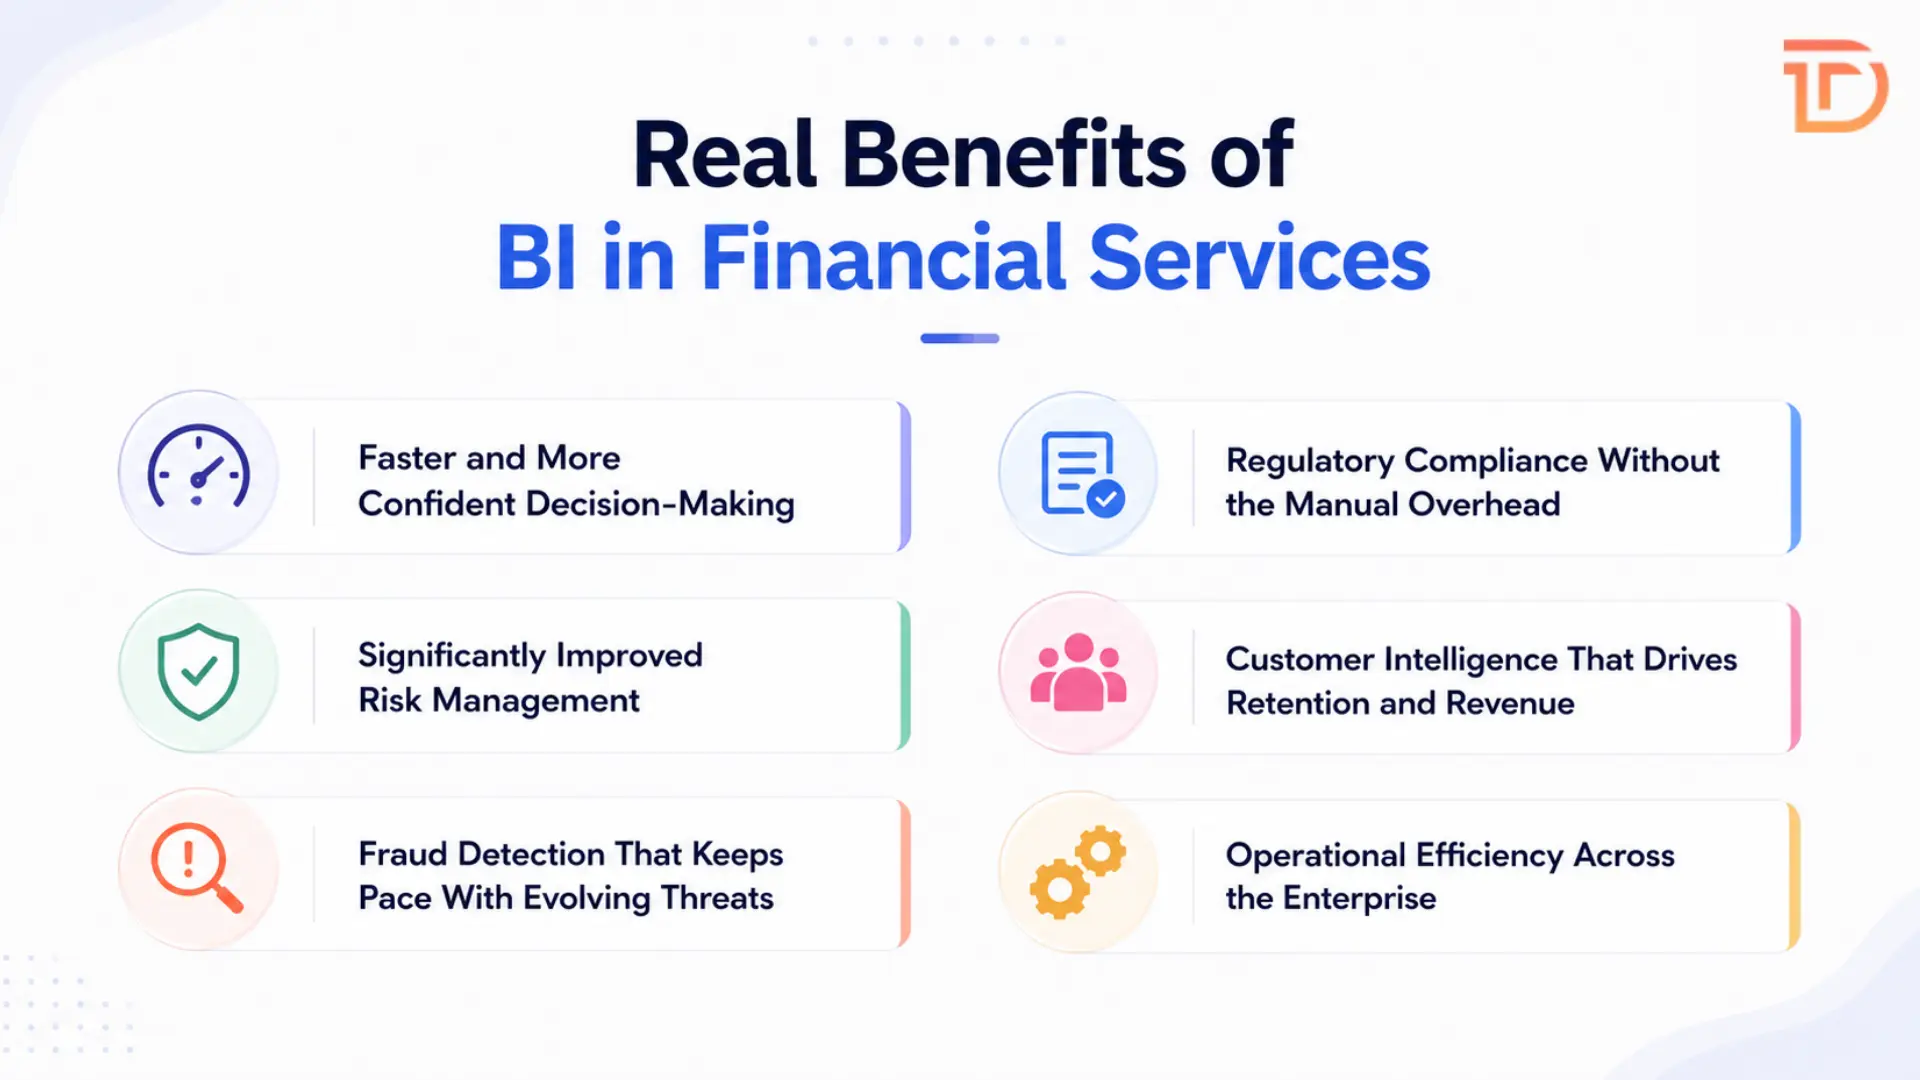
Faster and More Confident Decision-Making
Financial decisions carry significant consequences, whether they involve extending credit, adjusting pricing, rebalancing a portfolio, or flagging a suspicious transaction. When the data informing those decisions is delayed, incomplete, or requires extensive manual preparation, the quality of the decision suffers alongside the speed. BI tools for financial services replace that manual preparation cycle with automated data pipelines and real-time dashboards that give decision-makers access to current, reliable information when they need it rather than when the reporting cycle delivers it.
Significantly Improved Risk Management
Risk management in financial services has always been data-intensive, but the volume, velocity, and variety of risk-relevant data have grown substantially over the past decade. Business intelligence for banks and financial institutions provides the analytical infrastructure to monitor credit risk, market risk, liquidity risk, and operational risk continuously rather than through periodic manual reviews. Early warning indicators can be surfaced automatically, concentration risks can be visualized across the portfolio, and stress-test scenarios can be modeled against current positions rather than historical snapshots.
Fraud Detection That Keeps Pace With Evolving Threats
Fraud patterns change faster than rule-based detection systems can be updated. BI solutions for financial services, particularly those incorporating machine learning-based anomaly detection, identify deviations from established behavioral patterns in real time rather than after the fact. Unusual transaction sequences, geographic anomalies, velocity changes, and account activity inconsistencies can all be flagged and escalated automatically, significantly reducing the window between a fraud event occurring and the response being triggered.
Regulatory Compliance Without the Manual Overhead
Financial institutions operate under some of the most demanding regulatory reporting requirements of any industry. Producing accurate, timely, and auditable compliance reports across frameworks like Basel III, IFRS 9, AML, and KYC obligations has historically required substantial analyst time and carries significant risk of error when done manually. Financial services analytics platforms automate the aggregation, transformation, and formatting of compliance-relevant data, reducing both the cost of compliance and the risk of regulatory penalties from reporting errors or delays.
Customer Intelligence That Drives Retention and Revenue
Understanding customer behavior at a granular level is increasingly the basis of competitive advantage in financial services. How to use BI in financial services for customer intelligence involves connecting transaction data, product usage patterns, service interaction history, and demographic information to identify which customers are at risk of churn, which are ready for a product upgrade conversation, and which segments represent untapped revenue potential. Relationship managers with access to this kind of intelligence have more relevant and more timely conversations with clients, which translates directly into better retention and higher wallet share.
Operational Efficiency Across the Enterprise
Beyond customer-facing and risk-related applications, BI in financial services creates meaningful operational improvements across back-office functions. Branch performance benchmarking, cost center analysis, workforce productivity monitoring, and vendor contract performance tracking are all areas where BI dashboards replace manually compiled reports with automated, always-current views that managers can act on without waiting for the next monthly cycle.
Where BI in Financial Services Delivers the Most Measurable Value: Key Use Cases
The applications of financial services business intelligence span every major function within a financial institution. The following use cases represent areas where BI implementation has demonstrated consistent, measurable return on investment across the industry.
| Use Case | BI Application | Business Impact |
|---|---|---|
| Credit Risk Monitoring | Real-time dashboards tracking portfolio credit quality, delinquency trends, and concentration risk across borrower segments | Earlier identification of deteriorating exposures, reducing credit loss provisions |
| Fraud Detection and Prevention | Behavioral analytics and anomaly detection across transaction streams with automated alerting | Reduction in fraud losses and faster response times to suspicious activity |
| Customer Profitability Analysis | Multi-dimensional analysis of revenue, cost-to-serve, and product usage by customer segment | More targeted product offers and better allocation of relationship management resources |
| Regulatory Reporting Automation | Automated data aggregation and report generation for Basel, IFRS, AML, and other frameworks | Significant reduction in analyst hours and lower risk of reporting errors or missed deadlines |
| Branch and Channel Performance | Comparative performance dashboards across branches, digital channels, and advisor teams | Better resource allocation, faster identification of underperforming locations |
| Treasury and Liquidity Management | Real-time visibility into cash positions, funding gaps, and interest rate sensitivity | More precise liquidity management and better hedging decisions |
| Product Performance Tracking | Revenue, margin, and adoption metrics by product line with trend analysis | Faster identification of underperforming products and better product development prioritization |
| Collections Optimization | Predictive scoring and behavioral segmentation of delinquent accounts | Higher recovery rates and more efficient allocation of collections resources |
BI Tools for Financial Services: What the Technology Landscape Looks Like
The market for BI tools for financial services has matured considerably, and financial institutions now have a range of options spanning general-purpose enterprise platforms, industry-specific solutions, and custom-built applications. Understanding the landscape helps decision-makers choose an approach that fits their data environment, their technical capacity, and their specific analytical requirements.
General-Purpose Enterprise BI Platforms
Platforms like Microsoft Power BI, Tableau, and Qlik have been widely adopted across financial services because they offer powerful visualization capabilities, broad connectivity to common financial data sources, and established ecosystems of implementation partners. Power BI in particular has strong integration with Microsoft’s broader data and cloud infrastructure, making it a natural choice for institutions already operating on Azure or within the Microsoft 365 ecosystem. Understanding Power BI development cost is an important part of planning a BI implementation, as it varies significantly based on data complexity, the number of dashboards required, and the integration work involved.
Cloud-Native Analytics Platforms
As financial institutions migrate core infrastructure to the cloud, cloud-native analytics platforms like AWS QuickSight, Google Looker, and Snowflake-based analytics environments are becoming increasingly relevant. These platforms offer elastic scaling, tight integration with modern data architectures, and pricing models that align cost with actual usage rather than requiring large upfront licensing commitments.
Custom-Built BI Solutions
Some financial institutions, particularly larger banks, investment firms, and insurance companies with highly specialized data environments, benefit most from custom-built Business Intelligence Services tailored specifically to their data architecture, regulatory context, and analytical workflows. Custom solutions offer the highest degree of control over data governance, security architecture, and the specific metrics and visualizations that matter most to that institution’s business model.
The most effective BI implementations in financial services typically combine a proven platform for core reporting and visualization with custom development for the institution-specific calculations, metrics, and data integrations that no off-the-shelf solution handles well out of the box.
Key Applications of Business Intelligence Across Financial Services Sub-Sectors
How BI is used in financial services varies meaningfully across sub-sectors because the data environments, regulatory frameworks, and competitive pressures differ significantly between banking, insurance, asset management, and capital markets.
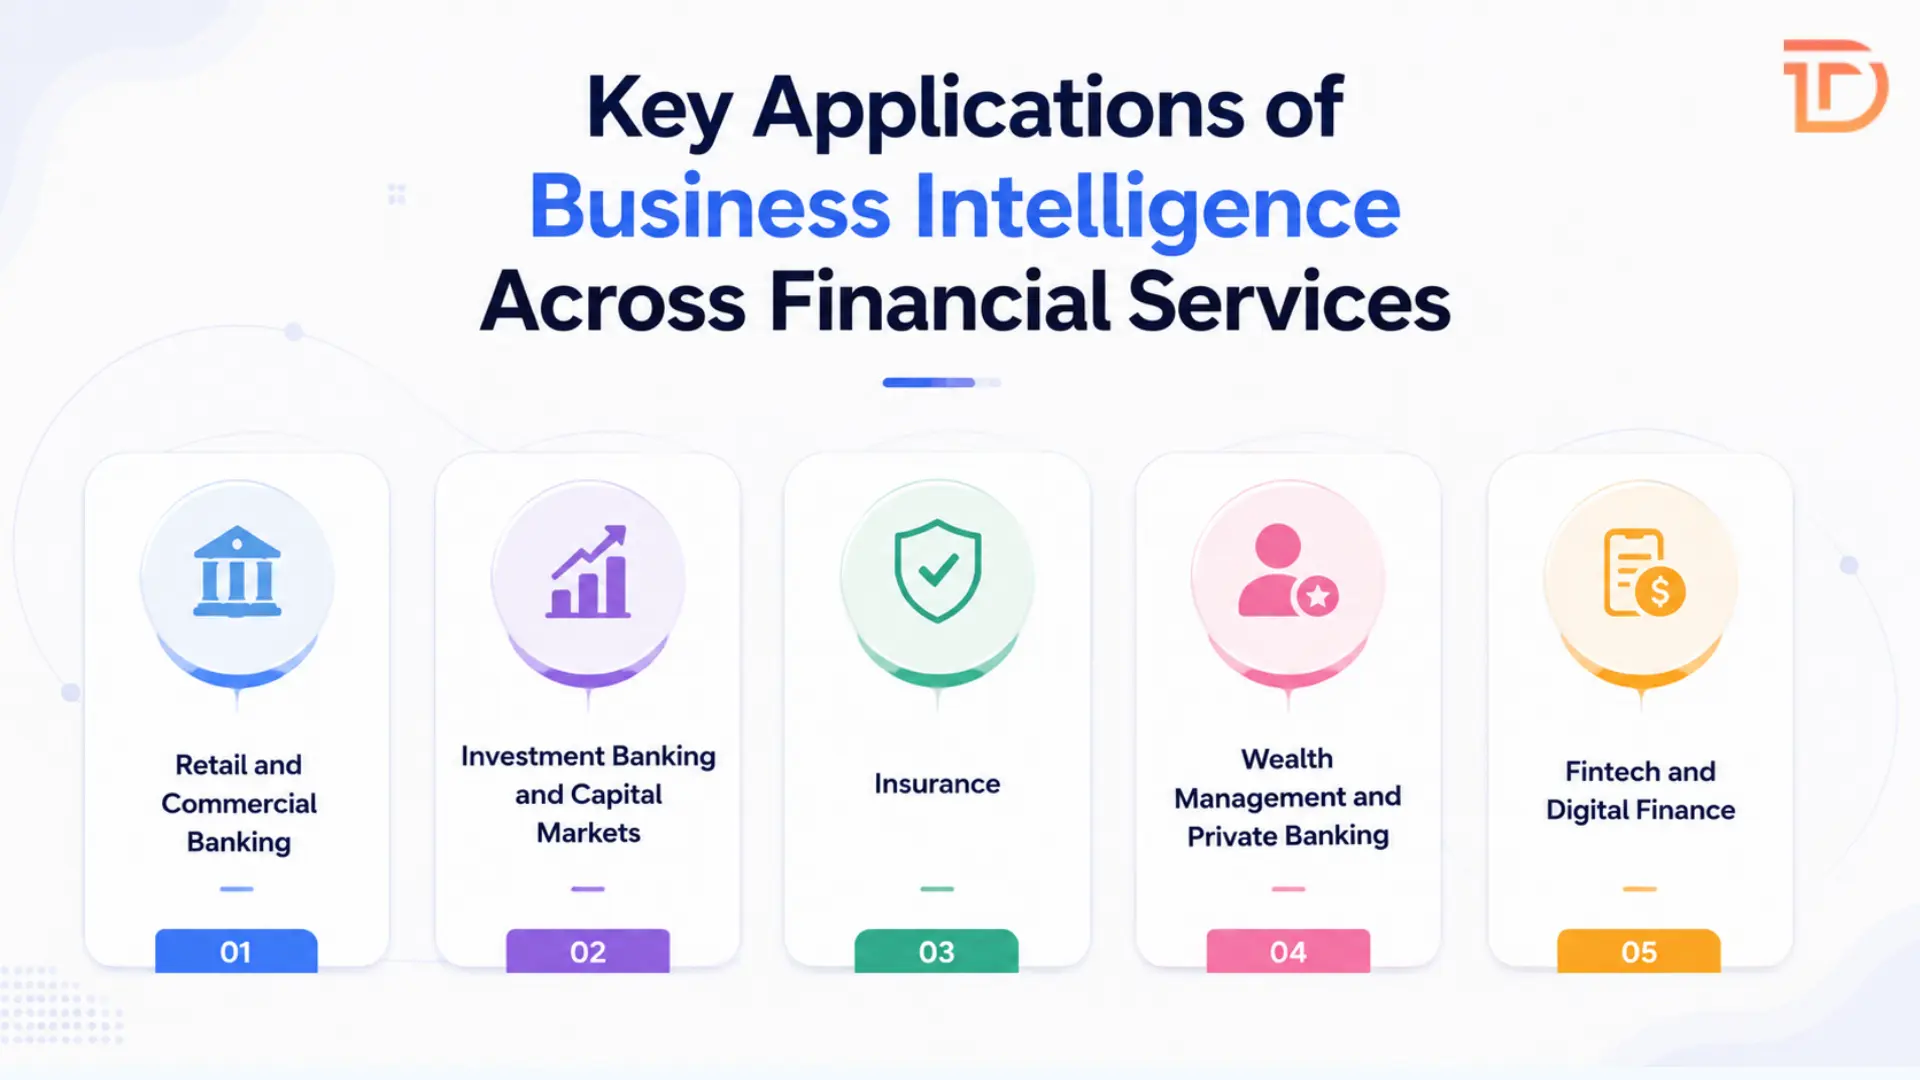
- Retail and Commercial Banking: Banks use BI primarily for customer behavior analysis, credit portfolio monitoring, branch performance management, and regulatory reporting. Real-time transaction analytics also supports fraud prevention and AML compliance monitoring across high-volume payment networks.
- Investment Banking and Capital Markets: In capital markets, BI supports trade performance analysis, position reporting, P&L attribution, and risk factor monitoring. The speed and accuracy requirements in this environment are particularly demanding, making real-time data pipelines and low-latency dashboards essential.
- Insurance: Insurance companies apply BI to claims analysis, underwriting performance monitoring, actuarial modeling support, and customer retention analytics. Identifying emerging claims trends early and understanding the profitability of different risk segments are core use cases.
- Wealth Management and Private Banking: Relationship managers in wealth management use BI to monitor client portfolio performance, identify rebalancing opportunities, and track engagement metrics that signal which clients may need proactive outreach. Client-facing reporting is also increasingly delivered through BI-powered digital portals.
- Fintech and Digital Finance: Fintech companies are among the most data-intensive users of BI because their entire operating model is built on digital interactions that generate dense behavioral data. Customer acquisition cost analysis, cohort performance tracking, product usage funnels, and real-time fraud scoring are all central to how fintech companies operate.
What to Get Right Before You Build or Buy a BI Solution for Financial Services
Selecting or building a BI solution for a financial institution involves considerations that go beyond the technical capabilities of the platform. The following factors consistently determine whether a BI implementation succeeds or falls short of its intended value.
- Data Quality and Governance Foundation: BI tools can only surface insights as reliable as the data flowing into them. Before selecting a platform or beginning development, financial institutions need a clear understanding of where their key data resides, how consistent and complete it is, and what governance processes are in place to maintain its integrity over time. Implementations that skip this foundation tend to produce dashboards that users stop trusting.
- Security and Data Residency Requirements: Financial data is among the most sensitive that any organization handles, and regulators have specific expectations around how it is stored, accessed, and transmitted. Any BI solution deployed in a financial services context needs a security architecture that satisfies the institution’s own standards, applicable regulatory requirements, and the data residency obligations that apply in each operating jurisdiction.
- Integration with Core Financial Systems: The value of financial services analytics depends directly on the breadth and depth of the data it can access. A BI solution that cannot connect reliably to core banking systems, loan origination platforms, trading systems, and CRM data has limited utility. Integration complexity is frequently the most challenging and most expensive part of a BI implementation in financial services.
- User Adoption and Change Management: The most analytically sophisticated BI solution delivers no value if the people it is built for do not use it. Financial institutions that invest in user training, involve business users in the dashboard design process, and actively manage the transition from spreadsheet-based reporting to BI-driven insights see substantially better adoption rates and faster return on investment.
- Scalability for Growing Data Volumes: Financial data volumes grow continuously as transaction volumes increase, regulatory reporting requirements expand, and new products generate new data streams. The architecture of any BI solution deployed in financial services needs to scale gracefully with that growth rather than requiring expensive re-architecture when data volumes exceed initial assumptions.
How Dreamer Technoland Helps Financial Services Organizations Get More From Their Data
At Dreamer Technoland, we provide end-to-end Business Intelligence Services designed for the specific data complexity, regulatory context, and performance requirements of financial services organizations. Our team has delivered BI solutions for banks, fintech companies, insurance providers, and financial software platforms, combining deep technical capability with a genuine understanding of how financial institutions operate.
Whether your organization needs a Power BI implementation to replace manual reporting workflows, a custom analytics platform built around your specific data architecture, or a data strategy review that identifies where BI investment will deliver the highest return, we design and build solutions that fit your environment rather than requiring your environment to fit a generic product template. If you are evaluating Power BI development cost for your institution, our team can provide a detailed scoping assessment that reflects your specific integration requirements, data volumes, and dashboard needs.
Our approach begins with understanding the decisions your business needs to make better and faster, then working backward from those decisions to identify the data, the integrations, and the visualizations that will support them most effectively. The result is a BI solution that business users actually find useful and that technical teams can maintain and extend as requirements evolve.
Dreamer Technoland builds BI solutions that financial services teams use daily rather than dashboards that look impressive in a demo and gather dust after deployment. The difference is in the discovery process that comes before the development.
The Financial Institutions Getting Ahead Are the Ones Reading Their Data Better
Business intelligence in banking and finance is the foundational technology that makes those capabilities possible. The market growth projections reflect adoption that is already happening at scale across the industry. The institutions investing in BI now are building a data intelligence layer that compounds in value over time as more decisions become informed by reliable, timely analytics rather than delayed manual reporting.
The starting point for most financial services organizations is identifying the two or three decisions that would benefit most from better data visibility, and then building from there. The full transformation of how a financial institution uses data rarely happens in a single project. It happens through a series of well-scoped implementations, each of which demonstrates value clearly enough to build confidence for the next.
Frequently Asked Questions
Q. What is BI in financial services and how does it differ from standard reporting?
Business intelligence (BI) transforms financial and operational data into actionable insights. Unlike standard reporting, BI offers real-time visibility, interactive analysis, and drill-down capabilities to support faster decision-making.
Q. Which BI tools are most commonly used in financial services?
Microsoft Power BI, Tableau, and Qlik are widely used, while AWS QuickSight, Google Looker, and Snowflake-based analytics are gaining adoption. Some institutions also use custom BI solutions for specialized data and regulatory needs.
Q. How does business intelligence help with regulatory compliance in financial services?
BI automates data aggregation, calculations, and reporting for requirements such as Basel, IFRS 9, AML, and KYC. It reduces manual errors, saves analyst time, and provides audit trails for regulatory reviews.
Q. What are the biggest challenges in implementing BI for a financial institution?
Key challenges include poor data quality, legacy system integration, data consistency, and user adoption. Successful BI projects prioritize data governance and integration alongside dashboard development.
Q. How long does it typically take to implement a BI solution in a financial services organization?
A focused BI implementation can take around 8 to 16 weeks, while broader enterprise solutions may take 6 to 18 months. A phased approach helps organizations deliver value faster and expand the solution over time.